The effect of varying the number of PCR cycles in the PCR-cDNA Sequencing Kit

Requirements
The effect of varying the number of PCR cycles in the PCR-cDNA Sequencing Kit
FOR RESEARCH USE ONLY.
Contents
Change log
Note: This document was generated using the SQK-PCS111 sequencing kit using our Kit 11 chemistry. We now recommend all our customer use our V14 chemistry kits (SQK-PCS114 and SQK-PCB114.24). The information contained in this document is still a relevant reference for our updated chemistry kits.
The PCR-cDNA Sequencing Kit (SQK-PCS111) is recommended when users have low amounts of input sample, as the PCR step increases the amount of template present. This ensures there is sufficient material to achieve optimal performance when the library is loaded on to the flow cell. However, the PCR process itself, can lead to bias and artefacts in the subsequent pool of products (Kanagawa, Journal of Bioscience and Bioengineering, 2003).
We prepared sequencing libraries of Universal Human Reference RNA (UHRR) total RNA (Agilent) and quantitative Spike-in RNA Variants SIRV-Set 3 (Lexogen), with varying input mass and numbers of PCR cycles to demonstrate their impact on the performance of the PCR-cDNA Sequencing Kit protocol (SQK-PCS111). The SIRV-Set 3 transcripts were spiked into each library at the beginning of the prep. This quantitative panel includes 92 unique transcripts designed by the External RNA Controls Consortium (ERCC) and have a dynamic concentration range of six orders of magnitude.
We observed that as input and number of PCR cycles increase, final library prep yields also increase (Figure 1a). Further, with increasing number of PCR cycles, the observed read lengths and read N50 values decrease (Figure 1b), illustrating an increase in relative PCR bias toward shorter reads as the total number of PCR cycles increases. Therefore, it is recommended to perform as few PCR cycles as possible to minimise such biases and artefacts. We generally find that an input of 200 ng of total RNA, amplified for 12–14 cycles of PCR, will generate enough material to load the recommended amount of library (15–50 fmol) onto a flow cell to obtain optimal overall sequencing yield.
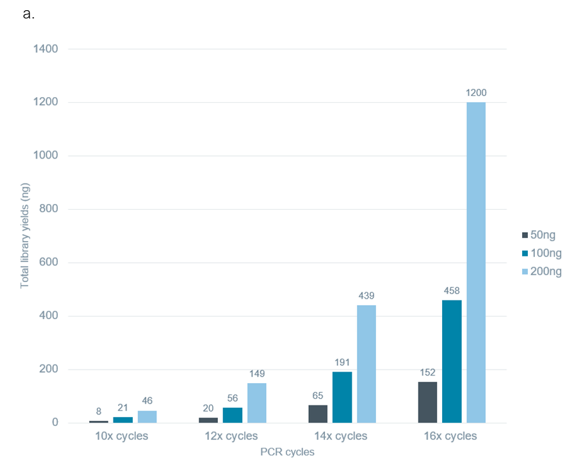
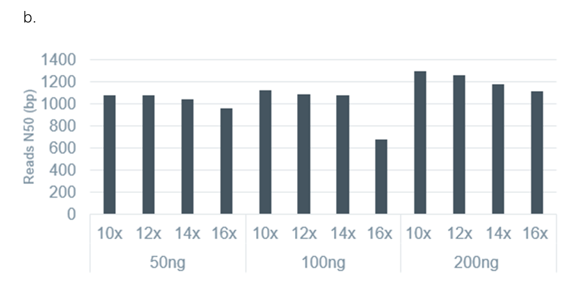
Figure 1. The library yields and read N50 values obtained from the PCR-cDNA Sequencing Kit (SQK-PCS111) protocol using varying input mass and PCR cycles. Sequencing libraries were prepared using the PCR-cDNA Sequencing Kit (SQK-PCS111) from 50, 100 or 200 ng Agilent UHRR total RNA and amplified with 10, 12, 14 or 16 PCR cycles. As the input amount and number of PCR cycles performed increase, the resulting library final mass yields increase (a). As the number of PCR cycles performed increases, the read N50 values decrease (b).
Comparison of expected versus observed transcript representation correlations were measured for the quantitative spike-in transcripts using Pearson’s log10 and Spearman’s rank coefficients. For all library conditions, the correlations for both measurement methods were ≥0.92, indicating a high confidence of transcript representation regardless of input mass or PCR cycle conditions (Figure 2a). Further, comparisons between each of the library conditions show high correlations indicating no observed transcript representation differences between the preps (Figure 2b and 2c). Therefore, while we recommend 200 ng of total RNA input mass and restricting to 12 or 14 PCR cycles as optimal library prep conditions, it is possible to decrease the input mass and/or increase PCR cycles without introducing transcript representation biases.
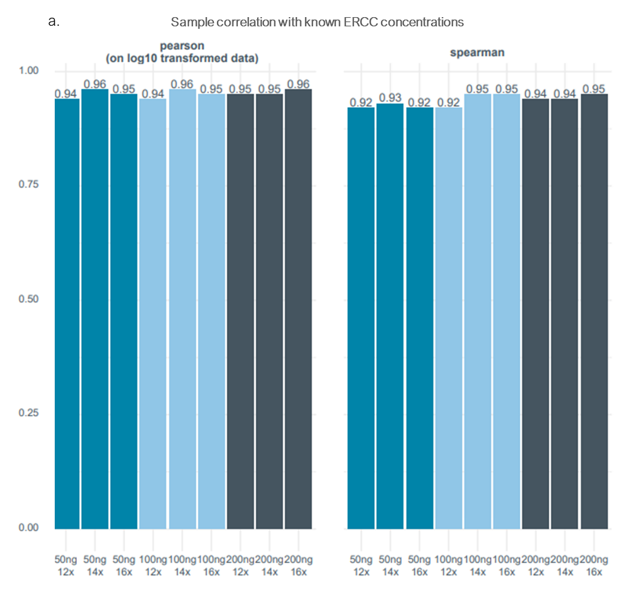
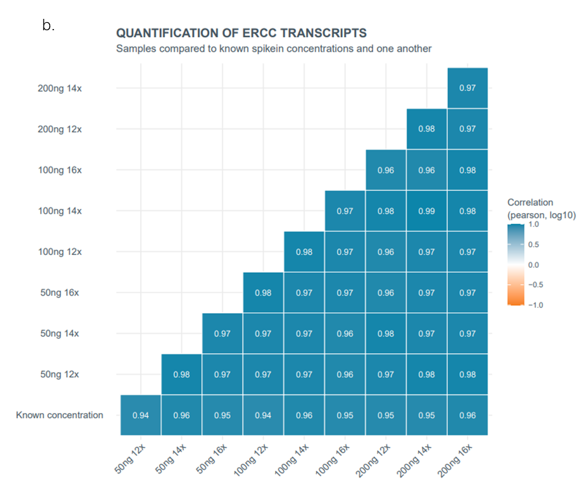
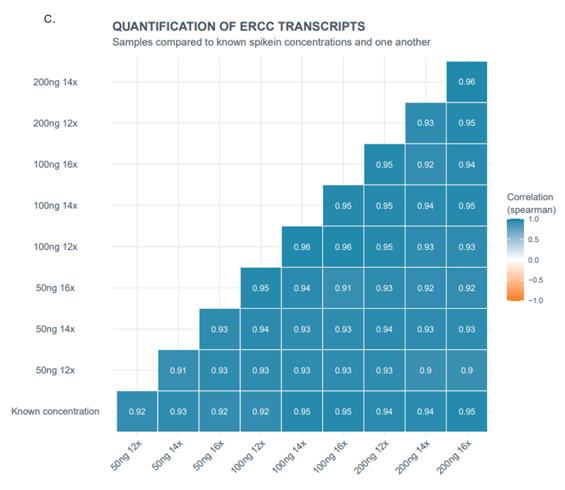
Figure 2. Spike-in expected versus observed correlations for Lexogen SIRV Set-3. SIRV Set-3 quantitative transcripts were spiked in (45 pg per 100 ng of total input mass) to each of the libraries prepared with differing UHRR total RNA input mass and PCR cycle numbers. The libraries were prepped and sequenced using the PCR cDNA sequencing kit (SQK-PCS111), with spike-in transcripts comprising roughly 1% of the total reads generated for each library prep. Expected versus observed transcript representation correlations for Pearson’s log10 and Spearman’s rank were calculated for the ERCC/SIRV spike-ins for each library (a). Correlations with Pearson’s log10 (b) and Spearman’s rank coefficients (c) were compared between the different input and cycle number library conditions. For each of the library condition comparisons the correlations were ≥0.94 (b) or ≥ 0.92 (c) indicating no significant biases.
Change log
| Date | Version | Changes made |
|---|---|---|
| October 2024 | V3 | Added wording at the start of the document to highlight the study was done on previous chemistry, but is still relevant to our V14 chemistry kits |
| March 2022 | V2 | The document has been updated with new data generated with the latest version of the PCR-cDNA Sequencing Kit (SQK-PCS111) |


