Rapid metagenomic sequencing for surveillance of bacterial, fungal and viral pathogens using SQK-RPB114.24 know-how document

Requirements
Rapid metagenomic sequencing for surveillance of bacterial, fungal and viral pathogens using SQK-RPB114.24 know-how document
FOR RESEARCH USE ONLY.
Introduction
Pathogen surveillance tools are of growing global importance with the rise in emerging and re-emerging infectious diseases. Utilising a metagenomics approach enables an unbiased, species-agnostic approach for the detection of unknown/novel and re-emerging pathogens.
Over the past decade, pathogen genomic surveillance has played a pivotal role in identifying new viral strains, developing diagnostic assays, therapeutics, vaccines, and monitoring disease transmission during epidemics and pandemics. Examples include the 2009 H1N1 influenza outbreak, Ebola virus (2014-2016), Zika virus (2016), and COVID-19.
We have developed a rapid metagenomic sequencing protocol for the identification of bacterial, fungal, and viral pathogens:
Our protocol provides an end-to-end workflow using the Rapid PCR Barcoding Kit V14 (SQK-RPB114.24) for the identification of bacteria/fungi and/or viruses/acellular organisms (Figure 1). Two options are provided for sample preparation dependent on the target pathogen and starting nucleic acid:
- The DNA-only bacterial/fungal sample preparation utilises SQK-RPB114.24 reagents to tagment all DNA in the extract for amplification and sequencing.
- The DNA/RNA viral sample preparation has been optimised by Oxford Nanopore Technologies, and is derived from a method established by Josh Quick and Ingra M. Claro. This method utilises a shotgun approach using 9N primers to randomly reverse transcribe RNA and subsequently PCR-amplify DNA/RNA present in a sample.
The sequencing data can be analysed using our bioinformatic analysis workflow wf-metagenomics, which provides abundance estimations of the sequenced microbial community and presence/absence of AMR conferring genes. Further bespoke analysis can be undertaken downstream, such as metagenomic assembly and phylogenetic analysis, to provide extra insight into the composition and functionality of the organisms in the community.
 Figure 1: End-to-end workflow for rapid metagenomic sequencing for surveillance of bacterial, fungal and viral pathogens.
Methods
Inclusivity panel testing
To confirm the detection of DNA viruses, RNA viruses, bacteria and atypical bacteria (intracellular or lacking a cell wall), the qualitative Zeptometrix NATtrol Respiratory Panel 2.1 was used (Table 1). In brief, 250 µl of either control 1 or 2 were spiked into 250 µl of diluted sputum (purchased from Cambridge BioScience) per sample and processed through both arms of the protocol.
Table 1: Organisms/viruses in Respiratory Panel 2.1 (RP2.1) controls. 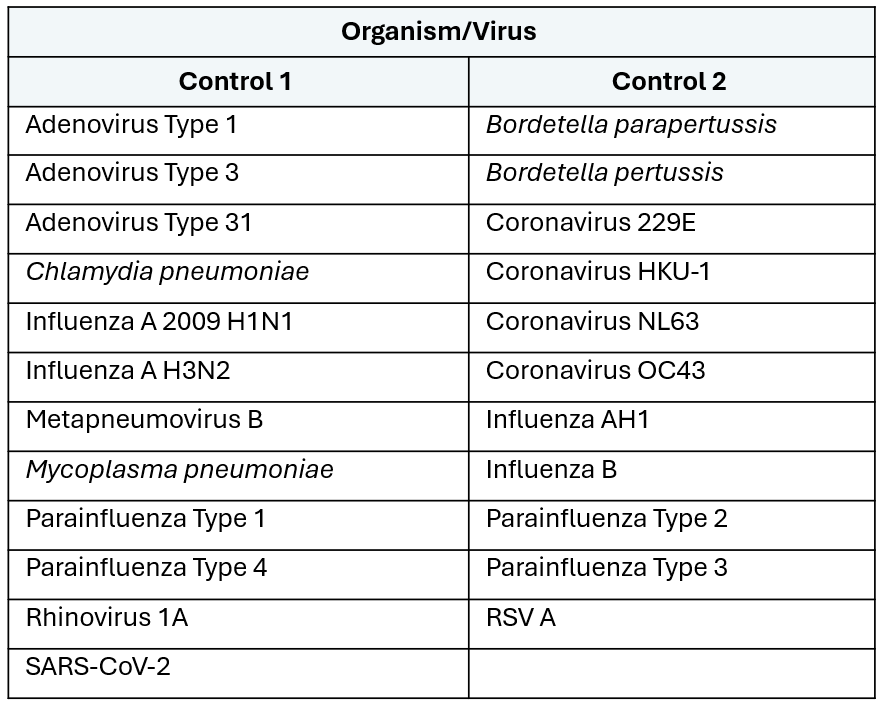
Input titration
To determine the lowest input for potential pathogens, three diluted sputum pools were aliquoted into six samples each. Samples were spiked with varying concentrations of a DNA virus (adenovirus), RNA viruses (RSV A and influenza A), a Gram-negative bacterium (Escherichia coli), a Gram-positive bacterium (Staphylococcus aureus) and a fungal species (Candida albicans) as detailed in Table 2.
Table 2: Input titration sample summary. 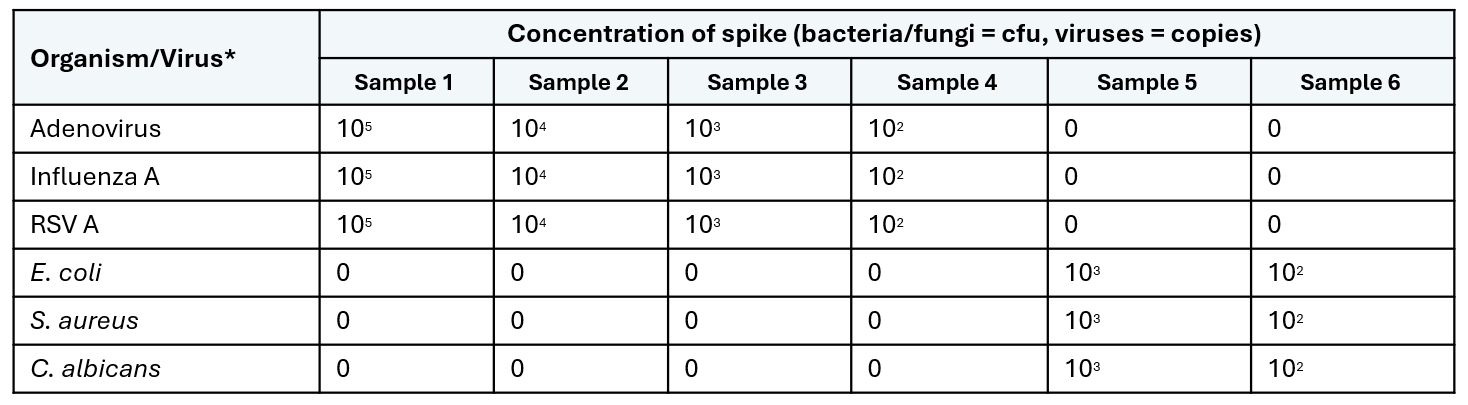 * Quantitative viruses were purchased from Zeptometrix and bacterial and fungal Vitroids were purchased from Sigma.
Results
Multiplexing up to 24 samples on a single flowcell
This protocol utilises the Rapid PCR Barcoding Kit V14 (SQK-RPB114.24) which allows the potential use of up to 24 barcodes in one sequencing experiment. When running both protocol arms, two barcodes are used per sample, therefore a maximum of 11 samples (plus a no template control - NTC) can be run per sequencing experiment.
Sequencing metrics are equivalent between 6-plex and 11-plex sample runs (24 and 72 hour run time, as seen in Table 3), therefore, the considerations on sample number is based on the data yield/coverage required per sample. Increasing the number of samples on the run inevitably reduces the data output per sample. Sequencing run time is also something to consider, increasing the run time from 24 to 72 hours approximately doubles the total output which can increase coverage, which can be important for genomic epidemiology and outbreak tracking.
Table 3: Sequencing metrics. 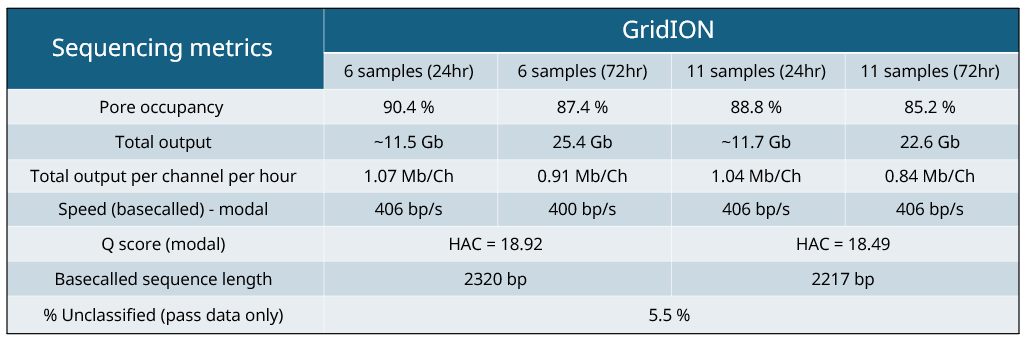
Inclusivity
This protocol enables the detection of DNA viruses, RNA viruses, bacteria and fungi. To demonstrate this, the qualitative Zeptometrix NATtrol Respiratory Panel 2.1 was used (fungal detection is detailed in the input titration section). As these controls are not quantitative, detection can be variable between replicates. The organisms present were reported at the species level, according to the NCBI taxonomy used in wf-metagenomics and therefore some viral subspecies appear as a single species in the results (i.e. influenza A H3N2 and H1N1 are combined).
All organisms/viruses can be detected from control panel 1, including the intracellular pathogen C. pneumoniae and M. pneumoniae which lacks a cell wall (Table 4a). These atypical/acellular bacteria are detected through the viral arm only. When using control panel 2, again all organisms/viruses can be detected with the exception of Coronavirus HKU-1, which is only present in the mix as a short sequence (as specified in the product information sheet - Zeptometrix), all other Coronaviruses in the control can be detected (Table 4b). Metapneumovirus is the other virus not detected, which is potentially due to the use of the smaller kraken database (8 Gb vs. 16 Gb). Using the larger database may improve overall performance. The bacterial pathogens B. parapertussis and B. pertussis are mainly detected in the bacterial arm, however, a small proportion of reads may appear in the viral arm as well.
Note: The 8 Gb database is fine for most users, however, the 16 Gb database may improve performance. Check system resources.
Table 4a: Summary of detection rates of qualitative respiratory control panel 1. 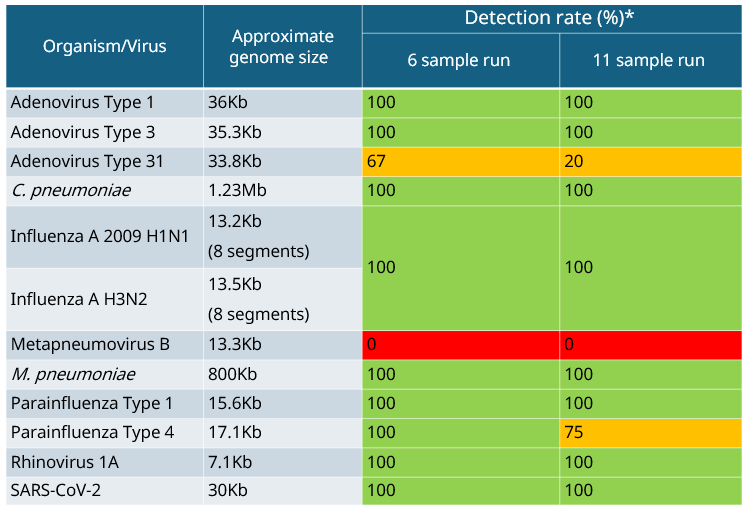 * Percentage of detection between the technical repeats (two biological repeats) which contained at least 10 reads.
Table 4b: Summary of detection rates of qualitative respiratory control panel 2. 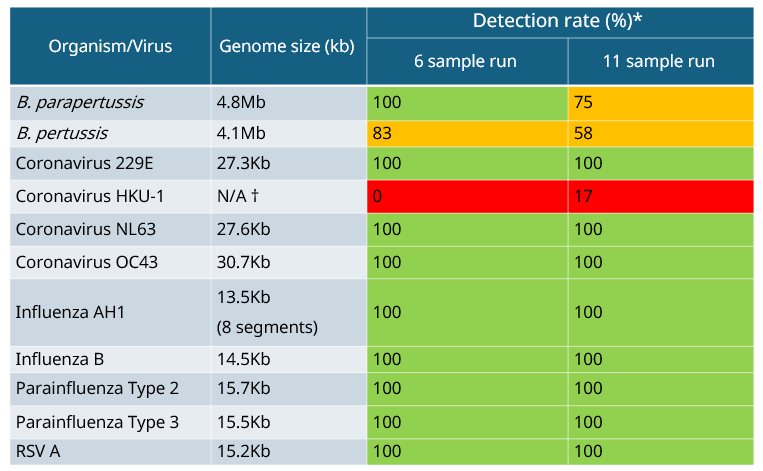 * Percentage of detection between the technical repeats (two biological repeats) which contained at least 10 reads.
†This analyte only contains a short sequence of the viral genome.
Segmented viral genome recovery
Method optimisation was focused on improving the detection of short, segmented viruses e.g. influenza A, when compared to the method originally established by Josh Quick and Ingra M. Claro.
Only three reads mapped to the influenza genome for the Quick method, giving limited coverage of the reference genome. In comparison, our method had >500 reads mapping to the reference and therefore ~50% of the influenza genome was covered at over 20x (Figure 2).
The Oxford Nanopore Technologies method shows good coverage of the reference genome due to the capture of smaller reads compared to the Quick method.
 Figure 2: Binned depth of mapped reads from the Oxford Nanopore Technologies and Quick methods across the influenza A genome*.
* Reads were mapped to the influenza A reference genome for both the Oxford Nanopore Technologies and Quick method datasets. Coverage was binned in single integer bins from 0–49 and then into a 50+ bin.
Input titration
To provide an estimate of assay sensitivity, three different sputum pools were used to show the lowest detection level of all viral/organism types. DNA (adenovirus) and RNA viruses (influenza A and RSV) were detected down to ~10^3-10^4 cp/ml (Figure 3). Gram negative (E. coli) and positive (S. aureus) organisms were detected down to ~10^3 cfu/ml and fungal species (C. albicans) down to 10^2 cfu/ml (Figure 4).
 Figure 3: Viral input titration.
 Figure 4: Bacterial and viral input titration.
Importance of sample normalisation
To demonstrate the importance of sample normalisation, data was generated where this step was carried out incorrectly and compared to previous results.
The median coverage levels of the bacterial and viral arms were calculated from 11 sample runs with correct and incorrect sample normalisation. The results clearly demonstrate the importance of correct sample normalisation post-PCR with extreme yields (measured in megabases) being observed when normalisation is poor (Figure 5).
When normalization was performed, the maximum and minimum yield observed was within 2x of the median of the total bases generated from each barcode. When normalization was not performed, the maximum yield observed in the bacterial arm was 13x higher (7.1 Gb) than the median (0.5 Gb), whereas for the viral arm this was 4x (0.5 Gb) higher than the median (0.1 Gb). The effect of normalization therefore greatly increases the reliability of the assay both within a run, and likely the reproducibility between runs.

Figure 5: Total base yield per barcode.
The importance of host depletion
Host depletion is required because of the high ratio of host to pathogen nucleic acids in clinical samples (~10^5:1 in sputum). The aim of the dual arm protocol is also to ensure bacterial/fungal species do not dominate viruses within a sample (as bacterial genomes are typically >1000x larger than viral genomes). The initial separation into the bacterial arm ensures the majority of bacterial/fungal cells are in the pellet but also so are most human cells. Therefore, it is essential to deplete the host to ensure sufficient bacterial/fungal detection.
To demonstrate this, data was generated where the host depletion step was omitted from both arms. On a normal run the number of human reads amounted to 1% of total reads, compared to a non-depleted data set where human reads accounted for 96% of total reads – a 100x reduction. The reduction in human reads leaves sequencing capacity for target organisms (bacterial, viral and fungal) and these classes of organisms experienced a 17.67x increase in read count in the depletion arm. The depletion step has the most drastic effect, as expected, on the bacterial arm, resulting in 40.85x higher organism reads when host depletion is performed (Table 5). And when using the Zeptometrix control 2, both B. pertussis and B. parapertussis were no longer detected (Table 6).
Table 5: Summary of human and target organism detection after host depletion. 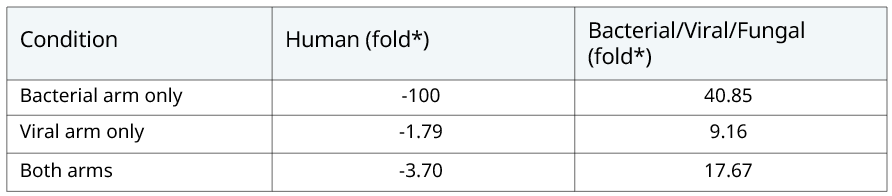 *Fold changes indicate the change in read count in the depletion condition relative to the non depletion condition. Fold changes less than 1 have been transformed into negative numbers (-1/x) to denote negative changes.
Table 6: Summary of bacterial detection rates with and without host depletion. 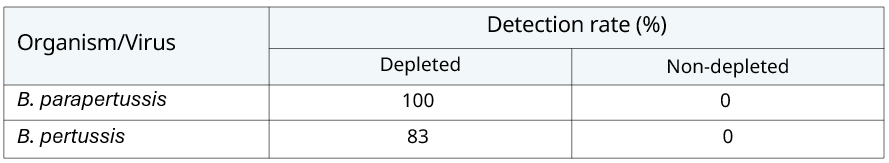
Change log
| Date | Version | Changes made |
|---|---|---|
| April 2025 | V1 | Document release |


