Chromatin accessibility know-how document

Requirements
Chromatin accessibility know-how document
FOR RESEARCH USE ONLY.
Contents
Introduction
Method overview
6mA tagging
gDNA extraction
Library preparation — Human Variation workflow
Sequencing performance
Analysis to detect 6mA in accessible chromatin regions
Data visualisation
- 6. Generating enrichment plots
- 7. Creating enrichment plots using Modkit
- 8. Visualization in a genome browser
- 9. Enrichment of 6mA at ATAC-seq peaks
- 10. Inference of accessible regions
Appendix
References
Change log
Introduction
Chromatin Accessibility (CA) is a technique designed to infer the genomic landscape of open chromatin in isolated nuclei using DNA methylation tagging. The method employs the nonspecific adenine methyltransferase EcoGII, which selectively methylates accessible adenine residues (A → 6mA) within the nuclei when supplied with the methyl group donor S-adenosylmethionine (SAM). Because 6mA is not a naturally occurring modification in the human genome, its incorporation serves as a proxy for identifying regions of open chromatin.
This document provides an overview of key insights gained during the development, optimisation, and benchmarking of the Chromatin Accessibility method. It also outlines best practices for data analysis, including available tools for interpreting 6mA incorporation, and offers strategies for visualisation, quantification, and integration with Modkit.
Method overview
The Chromatin Accessibility (CA) protocol can be found following this link. The workflow is structured into four main stages:
1. Chromatin Accessibility (6mA tagging of accessible chromatin):
Nuclei are isolated from freshly cultured cells using a detergent-based buffer (Sigma-Aldrich: NUC101) that preserves nuclear integrity. EcoGII methyltransferase (NEB: M0603S) and SAM are then added to tag accessible adenines (A → 6mA). Tagging occurs only at open chromatin sites, as dense heterochromatin restricts enzyme access (Shipony et. al) .
2. Genomic DNA extraction:
Following 6mA tagging, genomic DNA (gDNA) is extracted using a modified Puregene protocol (Qiagen). This adapted protocol is optimised for nuclei-based preparations, ensuring efficient recovery of high molecular weight DNA.
3. Library Preparation — Human Variation workflow:
Library preparation is performed using the Human Variation workflow, which is a method developed for optimal variant detection and phasing performance in human samples. The protocol incorporates size selection using the Short Fragment Eliminator (SFE) to enrich for long DNA fragments, shearing of DNA to the desired fragment length using the Megaruptor (Diagenode), and final library preparation using the Ligation Sequencing Kit (SQK-LSK114) for sequencing.
4. Analysis to detect 6mA in accessible chromatin regions:
Sequencing data is basecalled using dorado, and a 6mA model to detect 6mA incorporation, identifying regions of open chromatin which were accessible to the EcoGII methyltransferase. This includes variant and methylation calling, signal-to-noise quantification, and visualisation of 6mA profiles across the genome.
6mA tagging
An input of 2 × 10⁶ cultured cells is recommended to ensure sufficient recovery of genomic DNA (gDNA) for downstream processing (Appendix A). This cell input is necessary because the protocol includes a Short Fragment Eliminator (SFE) step, which requires a minimum of 3 µg of gDNA for optimal performance. While lower cell inputs may be feasible if the SFE step is omitted, this typically leads to shorter read lengths, potentially limiting the effectiveness of downstream analyses such as variant phasing, structural variant detection and assembly.
Nuclei isolation is performed using the EZ Nuclei Isolation Kit (Sigma-Aldrich: NUC101), which selectively lyses the plasma membrane while preserving the integrity of the nuclear envelope. This ensures that the EcoGII methyltransferase has direct access to the chromatin without compromising chromatin structure.
Following isolation, nuclei should be thoroughly resuspended in Sucrose-rCutsmart (CA) buffer to achieve a uniform, milky suspension that is free of visible clumps or debris: this step is critical to ensure even penetration of the EcoGII enzyme throughout the nuclei. Homogenisation is best achieved by vigorously flicking the tube or using a wide-bore pipette tip for repeated gentle aspirations.
Following re-suspension, nuclei are incubated with the EcoGII enzyme for 1 hour at 37°C. On occasion, we have observed time-dependent DNA fragmentation during this incubation period - most notably in an experiment using a particular batch of HG002 cells (Appendix B). To mitigate for fragmentation, we recommend that samples are kept on ice wherever possible, and that handling delays between steps are minimised.
We recommend using 10 µl of EcoGII (NEB: M0603S) in the Chromatin Accessibility reaction to balance high 6mA signal at open chromatin regions with low background noise. This volume was selected based on a titration experiment, which showed that while higher enzyme inputs increased 6mA incorporation at promoter sites, they also raised off-target methylation and reduced signal specificity (Appendix C). Using 10 µl enables reliable detection, improves cost-efficiency, and allows up to four reactions per NEB enzyme aliquot.
gDNA extraction
Genomic DNA (gDNA) is extracted using a modified Puregene protocol (Qiagen). This adapted protocol is optimised for nuclei-based preparations, ensuring efficient recovery of high molecular weight DNA suitable for generating long sequencing reads. Proteinase K is included during the lysis step, as it improves DNA elution efficiency following isopropanol precipitation, likely by enhancing protein digestion and therefore pellet solubilisation. Extraction volumes are reduced from the standard Puregene protocol to enable processing in 1.5 ml Eppendorf tubes using a standard benchtop centrifuge, streamlining the workflow and reducing reagent consumption.
DNA yield is quantified using the Qubit Broad Range (BR) kit, with expected yields of ~ 6–8 µg per extraction. Examples of gDNA yields are provided in Table A1. Fragment length assessment using Femto Pulse (Agilent) indicates that the extracted gDNA from the Chromatin Accessibility workflow typically contains a high abundance of fragments around 165 kb, with a fragment length distribution predominantly composed of high molecular weight material, as shown in Figure 1. Additional gDNA fragment distributions are shown in Figure A1 and Figure B1a, where we observed even higher fragmentation levels due to the time-dependent DNA fragmentation during the incubation period.
Library preparation — Human Variation workflow
SFE size selection
Following extraction, short DNA fragments are removed using the Short Fragment Eliminator kit (SFE), enriching the sample for high molecular weight DNA. Recovery efficiency is typically around >50%. SFE effectively removes the majority of fragments below 10 kb, as shown by the fragment length sizes before and after SFE treatment (Figure 1).
Megaruptor shearing
After SFE size selection, DNA is sheared using the Megaruptor (speed 25), to generate a fragment length of approximately 30 kb (Figure 1). This fragment length distribution is optimal for downstream analyses such as variant phasing and structural variant detection. Although faster shearing speeds may increase flow cell output by producing shorter DNA fragments, this should be done cautiously, as it may negatively impact applications that require long-read data. DNA quantification after Megaruptor shearing is recommended, as it tends to be more consistent and provides a more accurate measure of DNA concentration due to reduced sample heterogeneity (Table A1).
From an input of 2 million cells, DNA yield post fragmentation is measured using the Qubit Broad Range (BR) kit, with an expected recovery of ~4 µg, achieving a recovery of approximately 60% of the initial input (Table A1). Following DNA shearing, libraries are prepared from 3 µg of gDNA using the SQK-LSK114 kit. Final adapted ligated library yields typically range from 1.1 µg to 1.9 µg, representing an average recovery of 50% of the input DNA — sufficient for three PromethION flow cell loads (Table A1). To maximise sequencing output, flow cells must be washed and reloaded with fresh library using the EXP-WSH004 Wash Kit.
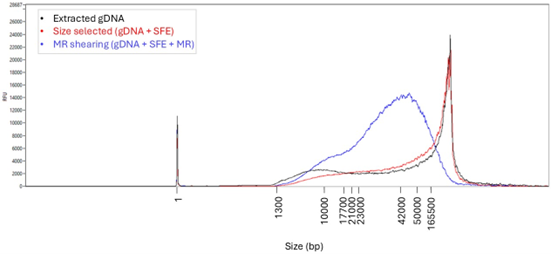
Figure 1. Femto Pulse Traces of gDNA Extracted Using the Chromatin Accessibility protocol. The traces illustrate the progressive changes in fragment length distribution at different stages of the workflow for sample 4 in (Table 1 and Table A1). Following extraction (black), short DNA fragments are removed using the Short Fragment Eliminator (SFE) buffer (red), and the recovered high molecular weight DNA subsequently sheared using the Megaruptor (MR) (blue).
Sequencing performance
Typical sequencing output
Sequencing yield is expected to exceed 100 Gb after a 72-hour run, with read length N50 of approximately 19 kb (Table 1). A representative read length distribution, Pore Activity, and Pore Scan reports for Chromatin Accessibility libraries are shown in Figures 2, 3, and 4, respectively.
Table 1. Representative sequencing output and read length of Chromatin Accessibility libraries. See Femto Pulse traces in Figure A1.
| Basecalled bases (Gb) | Basecalled N50 (kb) | |
|---|---|---|
| 1 | 109.2 | 23.3 |
| 2 | 105.9 | 19.2 |
| 3 | 113.6 | 18.9 |
| 4 | 98.3 | 18.9 |
| 5 | 115.8 | 17.4 |
| 6 | 112.1 | 17.8 |
| 7 | 106.4 | 21.5 |
| 8 | 95.5 | 22.5 |
| 9 | 109.4 | 20.3 |
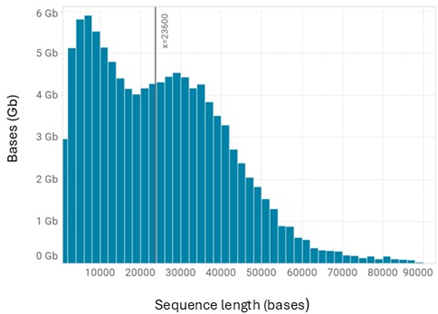
Figure 2. Typical Read length distribution for a Chromatin Accessibility library. The vertical line represents the read N50.
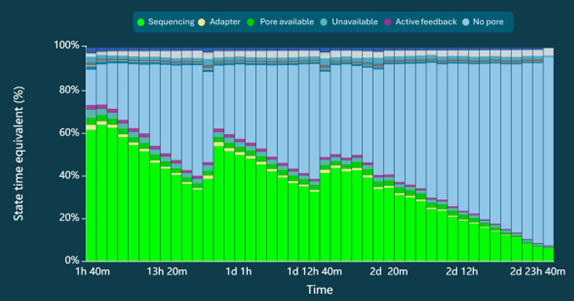
Figure 3. Pore Activity Report. The Chromatin Accessibility protocol is optimised to maintain a high pore occupancy during sequencing, represented by the high ratio of pore sequencing (light green) to pore available to sequence (dark green).
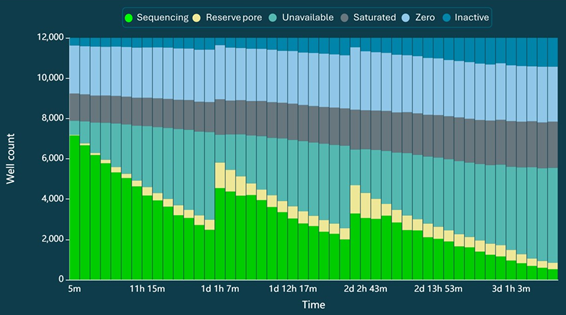
Figure 4. Pore Scan Report. Expected pore scan results for channels over a 72-hour run of Chromatin Accessibility. Following wash steps, a significant number of previously unavailable pores are expected to be recovered.
Analysis to detect 6mA in accessible chromatin regions
Comparison of Chromatin Accessibility (CA) and control datasets
To evaluate the performance of the Chromatin Accessibility (CA) method relative to a control method lacking 6mA tagging (Human Variation Workflow – HV), datasets were generated using matched HG002 cells and processed according to their respective protocols. Libraries were sequenced using PromethION Flow Cells.
Overall, sequencing performance was largely comparable between the two workflows, with similar total yields (~ 100 Gb) and aligned base counts. However, read lengths from CA preparations were found to be consistently shorter than those from HV (CA: N50 ~19 kb; HV: N50 ~30 kb; see Table 1). This reduction in read length is likely attributed to DNA fragmentation associated with CA processing (Appendix B). Despite the mild reduction in read lengths, the CA dataset showed a clear high signal of 6mA signal at promoter regions (>20%), with low background signal (<2%) elsewhere in the genome (Figure 5).
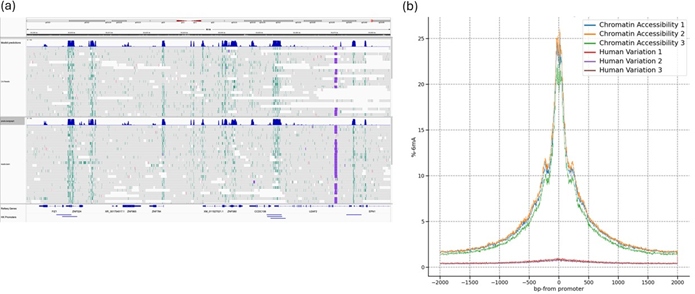
Figure 5. Detection of 6mA residues using visualisation tools. (a) Representative IGV browser view, displaying 6mA deposits (teal) and predicted chromatin accessible regions (dark blue) from the data sets Chromatin Accessibility 1 and 2 datasets. (b) Enrichment plot generated with Modkit for three Chromatin Accessibility runs, showing aggregated peak 6mA signal at housekeeping gene promoter regions and background levels of 6mA at non-promotor regions. A guide to creating these plots is provided in the Data Visualisation section below.
Basecalling accuracy
The basecaller model is trained to achieve the best balance of performance across a wide range of input samples. Both the High-Accuracy and Super-High-Accuracy basecallers have been exposed to a range of Chromatin Accessibility datasets, all generated with the EcoGII enzyme.
Sequencing reads are basecalled using a 6mA-aware Dorado v1.0.0 and HAC v5.2 models, which support detection of both canonical and modified adenines. Importantly, typical levels of 6mA tagging did not adversely impact read level accuracy, as identity Q-scores were found to be highly comparable between CA and control samples – HV (Figure 6). This allows the same sequencing data to be used for variant calling and other standard genomic analyses without modifications to the basecalling workflow.
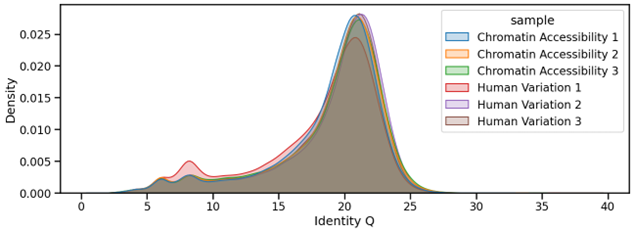
Figure 6. Identity Q-scores of reads processed using the Chromatin Accessibility (CA) method are equivalent to those obtained from Control samples (Human Variation Workflow – HV) lacking 6mA incorporation. This confirms that basecalling accuracy is maintained in the presence of low-level 6mA tagging.
Data visualisation
Generating enrichment plots
Enrichment plots (e.g. Figure 5b) can be useful to quickly check the activity of the enzyme as well as the quality of the preparation. These plots are based on knowing some regions of the genome which should be accessible to the methyltransferase ahead of time. While this may seem slightly circular, many model organisms have pre-annotated lists of promoters and housekeeping genes.
To support this analysis, a list of house keeping gene promoters in BED format for human (assembly hg38) and mouse (assembly mm10) is provided with the protocol.
Creating enrichment plots using Modkit
To generate the enrichment plots, the following steps are recommended:
$ modkit pileup $reads $pileup
$ bgzip $pileup
$ tabix $pileup.gz
$ modkit localize $pileup.gz –regions $promoters_bed –o enrichment_data.tsv
Documentation on using Modkit can be found online.
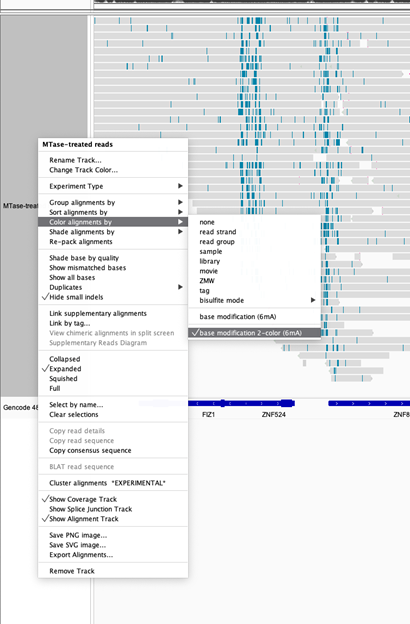
Visualization in a genome browser
Base modification calls for 6mA will occur at every adenine in the genome, which can become noisy to view in a genome browser. For a cleaner viewing in IGV, it is recommended to use the “2-color” mode and set the unmodified adenines (A) to grey. This highlights only the modified positions, making patterns in accessible regions easier to interpret.
Enrichment of 6mA at ATAC-seq peaks
Accessibility of chromatin to a methyltransferase as compared to a transposase (used in ATAC-seq) can vary slightly. We’ve have observed that some accessible regions are missed by matched ATAC-seq runs. Similarly, some regions that are accessible to the Tn5 transposase are less accessible to the methyltransferase. In our matched samples as well as other data we see a bimodal distribution of 6mA enrichment at ATAC-seq peaks (Figure 7).
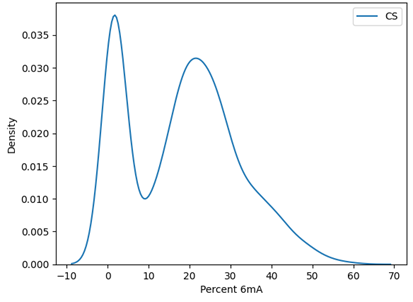
Figure 7. Distribution of 6mA enrichment at consensus ATAC-seq.
Inference of accessible regions
Inference of open chromatin can be done on a BAM of reads directly using Modkit.
$ modkit open-chromatin predict $bam –o $enriched_regions.bg
The default output is a bedGraph, which can be converted into a bigWig or other format.
Running Modkit with a GPU
The model for predicting regions of open chromatin will run considerable more quickly when using a GPU. A high-powered GPU is not required, but having one at all can speed up inference substantially. There is additional documentation about how to set up this analysis in your compute environment on the Modkit documentation page.
Appendix
Appendix A
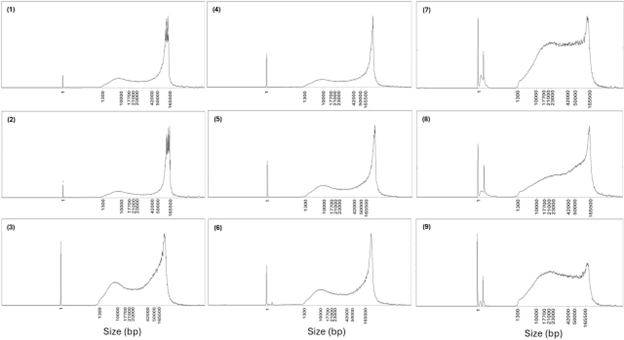
Figure A1. Femto Pulse traces showing the fragment length distributions of gDNA from Chromatin Accessibility samples, corresponding to the sequencing output detailed in Table 1. Most traces display a dominant peak of high molecular weight fragments (~ 50-165 kb), with a secondary peak of shorter fragments (~ 1.3 – 10 kb) that can be removed using the Short Fragment Eliminator. Samples 7, 8 and 9 show an increased abundance of intermediate fragments (~ 10-23 kb), however, sequencing read length N50s remained around 20 kb. The trace profiles in samples 7, 8 and 9 were from DNA extractions that didn’t include RNase A causing an RNA peak visible just after the lower marker peak.
Table A1. DNA yields and recoveries throughout the Chromatin Accessibility (CA) workflow.
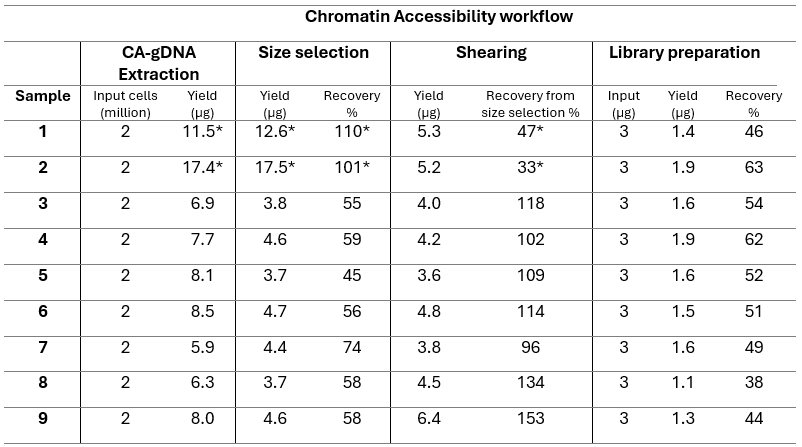 * Indicates an overestimated quantification of gDNA concentration.
Approximately 6–8 µg of gDNA is typically obtained from the extraction of 2 x 10⁶ cultured cells. However, if the solution is not fully homogeneous, DNA concentration may be overestimated, as observed in samples 1 and 2. The SFE step generally yields a recovery efficiency of ~50%. Following shearing with Megaruptor, approximately 4 µg of gDNA is expected. Quantification after shearing is usually more reliable, as the DNA is more homogeneous, providing a more accurate measure of concentration. Following library preparation, a typical recovery of average 1.5 µg of adapted ligated library is expected.
Appendix B
If DNA fragmentation is excessive, one mitigation strategy could be to reduce the EcoGII incubation period. However, this should be applied cautiously, as shorter incubation periods lead to a reduction in 6mA incorporation. Despite this, we have found that downstream analysis tools can tolerate as little as ~10% peak 6mA signal while still providing effective inference of open chromatin regions. This flexibility may allow users to prioritise DNA integrity in challenging sample contexts, whilst still obtaining interpretable results.
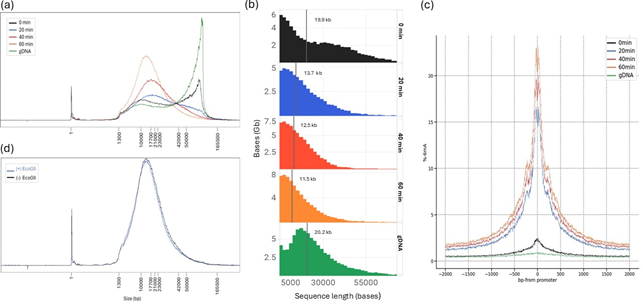
Figure B1. Time-dependent DNA fragmentation in Chromatin Accessibility protocol. (a) Nuclei were incubated with EcoGII for varying durations (0, 20, 40, and 60 minutes), and genomic DNA fragment length was assessed using Femto Pulse. A gDNA control sample without the Chromatin Accessibility protocol was included for comparison. (b) Sequence read length profiles from nuclei incubated with EcoGII for 0, 20, 40, and 60 minutes, the vertical line represents the read N50. (c) Peak 6mA signal was observed after 60 minutes of incubation, indicating that this duration yields the highest level of methylation at accessible chromatin regions. However, this also coincided with the greatest degree of DNA fragmentation, highlighting a potential trade-off between maximising 6mA signal and preserving DNA integrity. (d) Femto Pulse traces of samples treated with (+) and without (-) EcoGII enzyme show that DNA fragmentation occurred independently of EcoGII activity. However, we did not determine whether this fragmentation was caused by endogenous nuclease activity, or from possible contamination from the prepared buffers.
Appendix C
The titration datasets demonstrate that as the volume of EcoGII increases, global 6mA incorporation levels rise (Figure C1a), introducing additional modified bases throughout the genome and reducing basecalling alignment identity (Figure C1b). We therefore suggest using an amount of enzyme that introduces 6mA at a low enough level (background levels [3–5] %) to allow detection of accessible chromatin without sacrificing read accuracy.
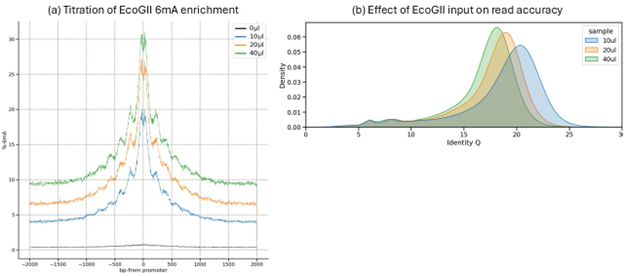
Figure C1. Impact of EcoGII enzyme titration. (a) Enrichment profiles showing the effect of EcoGII enzyme volume on 6mA signal at promotor and distal regions. The optimal balance between a strong peak 6mA and low background noise is observed with 10 µl of EcoGII. (b) Density plots showing the effect of increasing EcoGII enzyme on the distribution of identity-Q, indicating that 10 ul of EcoGII yields the highest read accuracy.
References
Shipony, Z., Marinov, G.K., Swaffer, M.P. et al. Long-range single-molecule mapping of chromatin accessibility in eukaryotes. Nat Methods 17, 319–327 (2020). https://doi.org/10.1038/s41592-019-0730-2
Change log
| Date | Version | Changes made |
|---|---|---|
| July 2025 | V1 | Document release |


