Input DNA/RNA QC (IDI_S1006_v1_revD_10Oct2025)
Protocol
V IDI_S1006_v1_revD_10Oct2025
FOR RESEARCH USE ONLY
1. Introduction to DNA quality control
It is important that you check your input DNA for quality before beginning library preparation. Incorrectly quantified and/or contaminated DNA (e.g. with salt, EDTA, protein or organic solvents) can have a significant impact on downstream processes and ultimately on your sequencing runs. Below are some guidelines for how to check the DNA quality to ensure the highest possible throughput.
Access to laboratory equipment is not always possible in field conditions therefore, we recommend that you optimise extraction and purification methods in the laboratory, before starting fieldwork.
2. Quantification of DNA
We recommend obtaining accurate measurements of how much DNA you have and assessing its purity, and size where possible, following DNA extraction from your sample and before library preparation. It is important to make sure that the correct amount of high quality material is used for library preparations.
| Criteria | Size of DNA fragment | Equipment for measurement |
|---|---|---|
| Mass | n/a | Qubit™ fluorometer using Qubit™ dsDNA Broad Range (BR) Quantification Assay (Thermo Fisher Scientific) |
| Size | <10 kb >10 kb | 2100 Bioanalyzer (Agilent) or equivalent, or pulsed-field gel electrophoresis Femto Pulse System (Agilent) or pulsed-field gel electrophoresis |
| Purity | n/a | NanoDrop™ 2000 Spectrophotometer (Thermo Fisher Scientific) or equivalent DNA samples should have an OD 260/280 ratio of ~1.8 and an OD 260/230 ratio of 2.0–2.2. |
Table 1. Recommended equipment for the measurement of DNA mass, size, and purity.
To quantify the mass of DNA samples, we recommend using the Qubit fluorometer with the Qubit dsDNA Broad Range (BR) Assay Kit. To assess size, we recommend the use of the Agilent 2100 Bioanalyzer (or equivalent) or gel-based analysis for short DNA fragments (<10 kb). To obtain molar quantification of short fragment samples, both mass and size measurements are required. While molar quantification is not required for samples that comprise of long fragments, we would still recommend measuring the size of your sample. If you are interested in generating long reads, you need to verify that your sample contains long fragments. We recommend using pulsed-field gel electrophoresis or the Agilent Femto Pulse System. The Agilent 2100 Bioanalyzer is not suitable for measuring the size of fragments >10 kb.
There are established methods for generating high quality, high molecular weight (HMW) genomic DNA (gDNA) which should be used when preparing gDNA for sequencing. Several of these methods are described in detail in Sambrook J, and Russell DW, (2001) Molecular Cloning: A Laboratory Manual, 3rd Edition, Cold Spring Harbor Laboratory Press, Cold Spring Harbor, New York.
For long-term storage of HMW gDNA, we recommend the use of TE buffer.
3. Assessing DNA mass
We recommend that the DNA stock is quantified using a Qubit fluorometer which specifically measures DNA. Residual RNA is a common contaminant in gDNA preparations which is not well identified by NanoDrop measurements. Incorrect quantification could mean that you will proceed with less DNA than intended, resulting in poor sequencing performance. Also, contamination from bases (such as dNTPs and NTPs) will interfere with NanoDrop measurements. Therefore, we recommend that a Qubit fluorometer is used for all quantification (i.e. following all clean-up steps).
Additionally, high concentration, and high molecular weight DNA preparations (and those with heavy RNA contamination) can lack homogeneity, which will give rise to inaccurate quantification. If you encounter this with your RNase-treated DNA sample, we recommend that you dilute the DNA further with TE buffer, and rotate the tube gently until the suspension is homogeneous. Vortexing the DNA or pipetting up and down will cause shearing, which will in turn limit the fragment sizes available to the nanopores.
4. Assessing DNA purity
Chemical impurities such as detergents, denaturants, chelating agents, and high concentrations of salts should be avoided as these may affect the efficiency of enzymatic steps during library preparation. Please refer to the Contaminants document for more details.
Other contaminants such as single stranded DNA, RNA, proteins, and dyes may also reduce the efficiency of steps in library preparation.
The purity of DNA can be assessed by using a NanoDrop for samples with concentrations >20 ng/µl.
We recommend that the DNA sample has a 260/280 ratio of ~1.8 and a 260/230 ratio of 2.0–2.2.
A 260/280 ratio higher than 1.8 indicates the presence of RNA.
A 260/280 ratio lower than 1.8 can indicate the presence of protein or phenol.
A 260/230 ratio significantly lower than 2.0–2.2 indicates the presence of contaminants, and the DNA may need additional purification.
In the NanoDrop trace shown below, the 260/230 ratio for Sample 1 was ~1.0 and the resulting library performed poorly in a sequencing run. If additional purification is not possible, amplification of the DNA by PCR can be performed to improve its quality.

Figure 1. Assessment of the purity of DNA samples using a NanoDrop.
5. Assessing molecular weight
Nanopore sequencing devices generate reads that reflect the lengths of the fragments loaded onto the flow cell. To have control over the size of the fragments generated during library preparation, it is important to begin with HMW DNA.
Conventional agarose gels cannot resolve DNA fragments greater than 15–20 kb. However, the molecular weight of starting material can be measured by pulsed-field gel analysis.

Figure 2. Lambda phage DNA run on an agarose gel. The sample on the left shows intact, high molecular weight (MW) fragments. The sample on the right shows a significant proportion of low molecular weight fragments.
Samples can be run on low percentage agarose gels in order to detect degradation or shearing.

Figure 3. DNA samples run on a low percentage agarose gel. The DNA in Sample 1 is of high molecular weight. In Sample 2, the DNA is of low molecular weight and has sheared.
Recommendation for DNA starting input for the Ligation Sequencing Kit V14
| DNA fragment size | Starting input |
|---|---|
| <10 kb (short) | 100–200 fmol |
| >10 kb (long) | 1 µg |
Table 2. Recommended DNA starting inputs for library preparation with the Ligation Sequencing Kit V14 (SQK-LSK114).
The sequencing outputs from various
DNA starting inputs are shown below: 
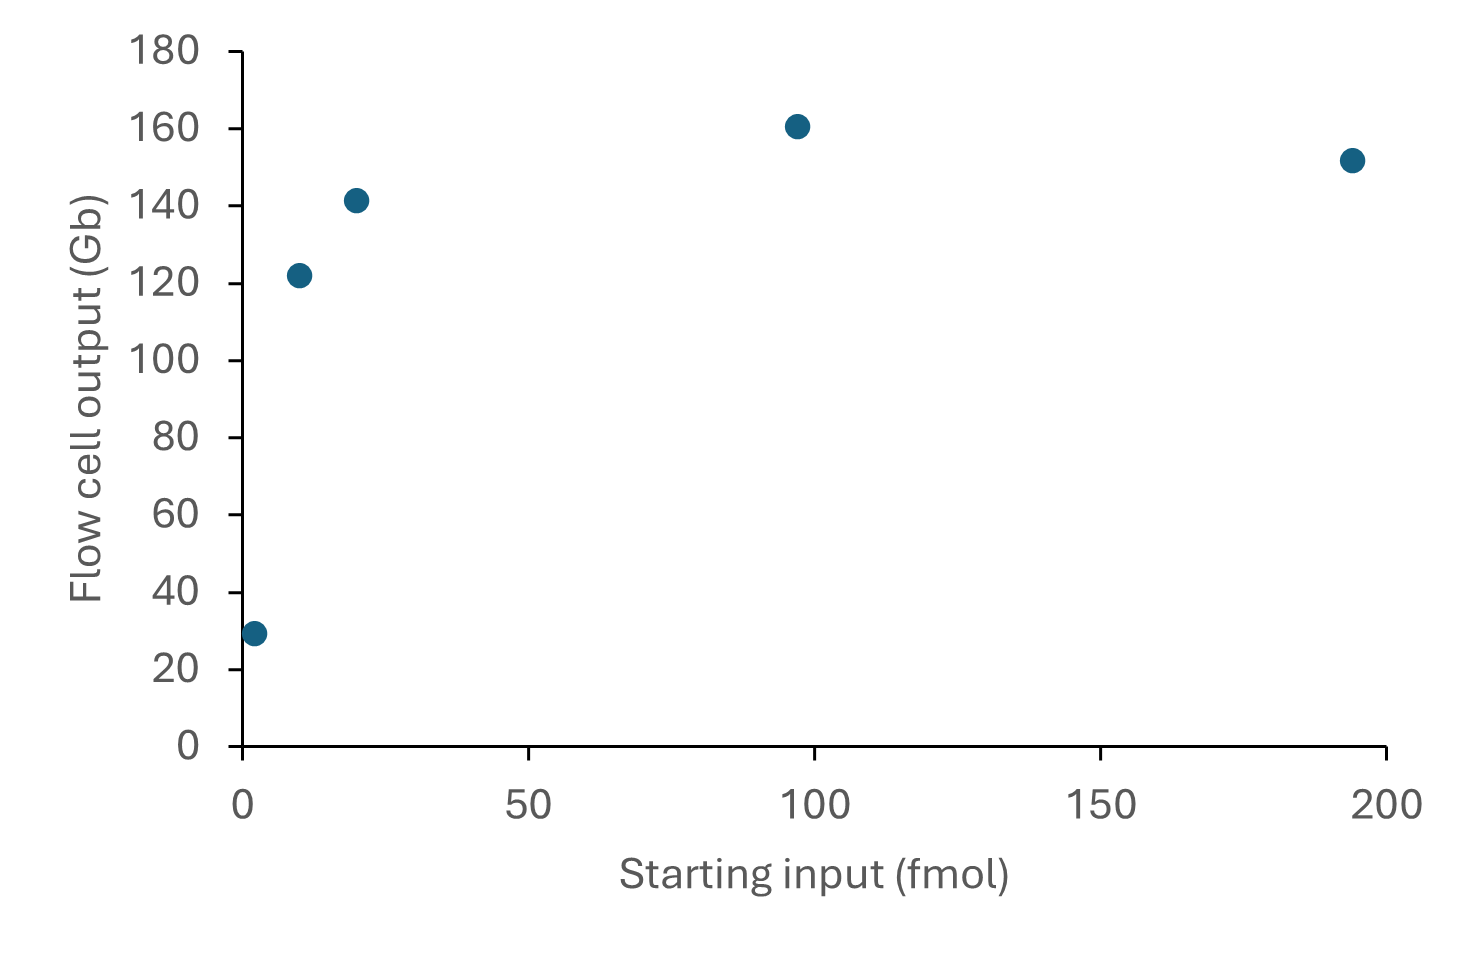
Figure 4. Sequencing output per flow cell for various starting inputs of a human DNA sample consisting of ~8 kb fragments. The DNA was prepared for sequencing using the Ligation Sequencing Kit V14 (SQK-LSK114) and sequenced on a PromethION for 72 hours. A starting DNA input of 100 or 200 fmol (recommended for DNA fragments <10 kb in Table 2) provided optimal sequencing outputs of >100 Gb reads.
We found that molar quantification is difficult and unreliable for samples comprising of long fragments.
For samples with a wide distribution of fragment sizes, e.g. gDNA, start with 1 μg of material for the Ligation Sequencing Kit.
For short fragment libraries, e.g. amplicons or cDNA, start with 100-200 fmol of material.
Lower DNA inputs can be used for kits which have a PCR step included as part of the protocol. Please refer to individual library preparation protocols for details.
If you are unable to quantify the mass of your input DNA, then please use the Table below as a guide. Take forward the appropriate amount of DNA based on the average fragment size and known concentration.
| Mass | Molarity if fragment size = 200 bp | Molarity if fragment size = 1 kb | Molarity if fragment size = 8 kb | Molarity if fragment size = 20 kb |
|---|---|---|---|---|
| 2000 ng | 100 fmol | |||
| 1000 ng | 200 fmol | 50 fmol | ||
| 500 ng | 500 fmol | 100 fmol | 25 fmol | |
| 250 ng | 250 fmol | |||
| 100 ng | 950 fmol | 100 fmol | 20 fmol | 5 fmol |
| 50 ng | 450 fmol | 50 fmol | 10 fmol | 3 fmol |
| 25 ng | 250 fmol | |||
| 10 ng | 100 fmol | 10 fmol | 2 fmol | |
| 5 ng | 50 fmol |
Table 3. Guide for input DNA mass for varying fragment sizes and concentrations.
6. Assessing fragmentation
Following fragmentation, the quality of the fragmented DNA can be assessed by different methods e.g. using the Agilent Bioanalyzer.

Figure 5. Analysis of fragmented DNA samples using an Agilent Bioanalyzer. Sample 1 showed successful fragmentation and Sample 2, unsuccessful fragmentation as demonstrated in the trace from the Bioanalyzer. Sample 2 contains a substantial proportion of short fragments. This is possibly a result of incorrect fragmentation, or these short fragments may have been present in the starting input sample.
7. Assessing DNA recovery during library preparation
We recommend performing QC checks at certain points in the library preparation process. This will allow you to check the quantity of DNA at each stage. Starting with 1 µg of DNA (as measured on a Qubit fluorometer), the Table below outlines the expected DNA recovery following end repair, dA-tailing and adapter ligation with the Ligation Sequencing Kit by first time/new and experienced users.
| First time/new users | Experienced users | |
|---|---|---|
| Expected library recovery from 1 µg of DNA starting input | 350–500 ng | 600–800 ng |
| Expected percentage of library recovery from starting input | 35–50% | 60–80% |
Table 4. Expected quantity and percentage of DNA library recovery when starting with 1 µg of g-TUBE (Covaris) fragmented gDNA input and following end-prep and adapter ligation with the Ligation Sequencing Kit V14 (SQK-LSK114).
Recommendation for DNA library loading input on the flow cell
In order to maximise sequencing yield, it is important that the nanopores are kept filled with DNA, to minimise the time that they are idle between strands. If less DNA goes into the flow cell, fewer 'threadable ends' will be present to be captured by the pores. As a result, the pores will be searching for molecules to sequence instead of sequencing continuously. If the pores are not sequencing continuously, throughput could be compromised. We have found that in order to keep the pores full, the current R10.4.1 flow cell requires the following mass of 'good quality library':
| DNA fragment size | Library mass for sequencing |
|---|---|
| <1 kb | 100 fmol |
| 1–10 kb | 35–50 fmol |
| >10 kb | 300 ng |
Table 5. Recommended library mass for loading on flow cells depending on fragment size. Libraries were prepared using the Ligation Sequencing Kit V14 (SQK-LSK114).
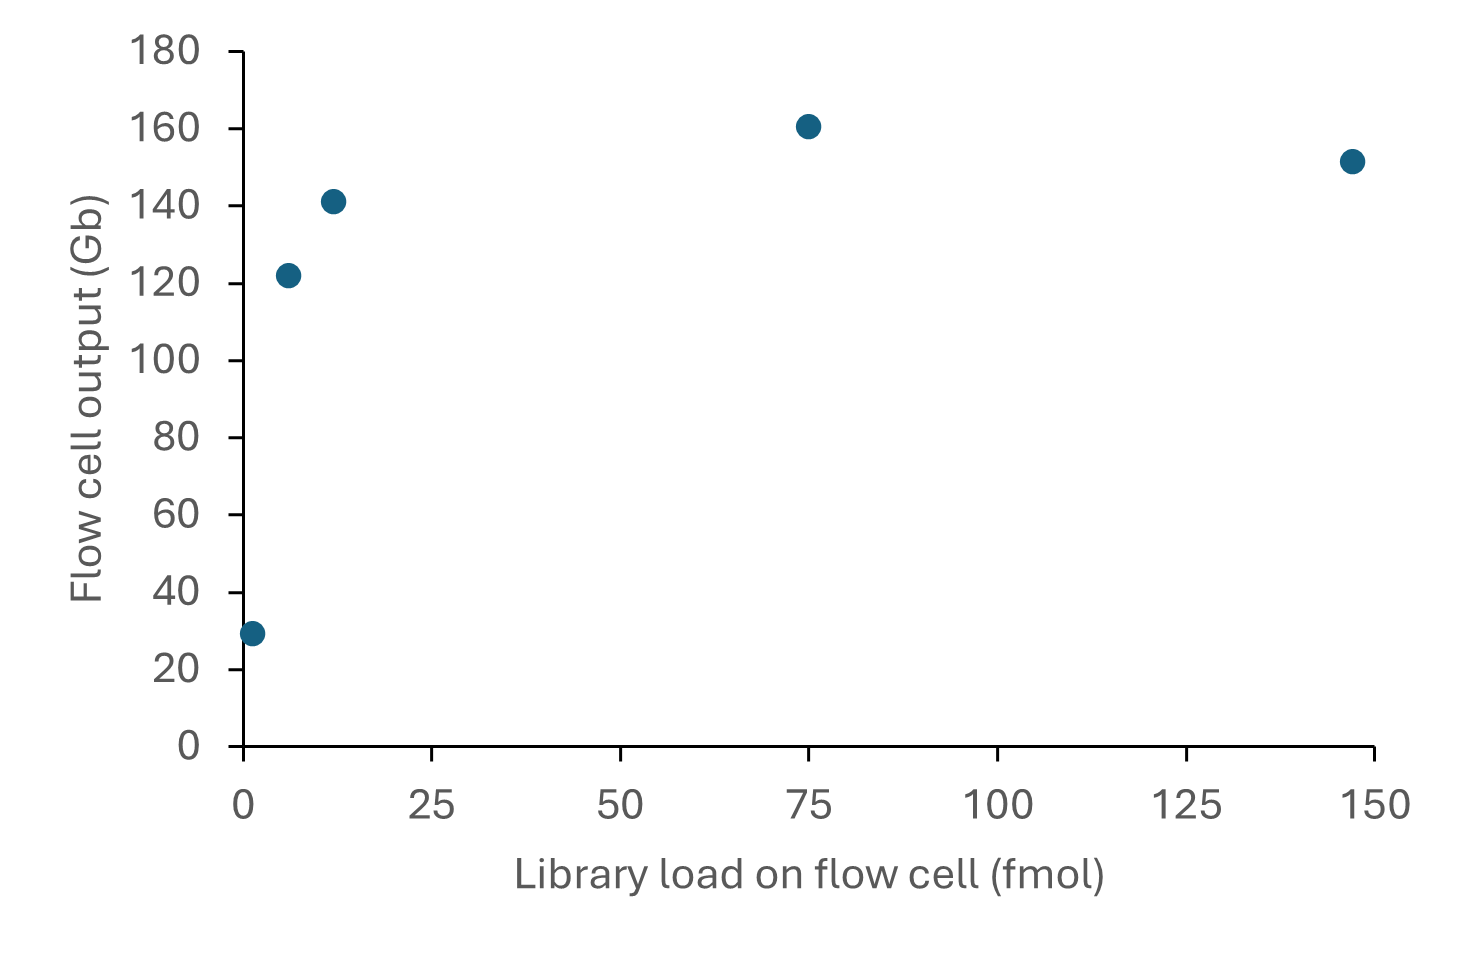
The relationship between library input and output from R10.4.1 flow cells when using the Ligation Sequencing Kit is shown below:

Figure 6. Sequencing output per flow cell for various library inputs of a human DNA sample consisting of ~8 kb fragments. The DNA was prepared for sequencing using the Ligation Sequencing Kit V14 (SQK-LSK114) and sequenced on a PromethION for 72 hours. A library loading input of 12 or 75 fmol on the flow cell provided sequencing outputs of >100 Gb reads.
We have observed that sequencing throughput depends partly on fragment size. Shorter fragments take less time to be processed/sequenced compared with longer fragments. This is due to the pores returning to the open state more often with shorter fragments than when sequencing longer fragments.
8. Introduction to RNA quality control
It is important that you check your input RNA for quality before beginning library preparation. Incorrectly quantified and/or contaminated RNA (e.g. with salt, EDTA, protein, or organic solvents) can have a significant impact on downstream processes and ultimately, your sequencing runs. Below are some guidelines for how to check the RNA quality to ensure the highest possible throughput.
Access to laboratory equipment is not always possible in field conditions therefore, we recommend that you optimise extraction and purification in the laboratory, before starting fieldwork.
9. Input RNA mass and molarity
Oxford Nanopore protocols recommend an input quantity in mass (e.g. 50 ng), as it is relatively easy to measure. The library preparation kit components are prepared with these input amounts in mind, but are robust to deviations from the input amount. However, if you are unable to quantify your input RNA mass, please refer to the Table below as a guide. Then, take forward the appropriate amount of RNA based on the average fragment size and known concentration.
| Mass | Molarity if fragment size = 0.5 kb | Molarity if fragment size = 1.5 kb | Molarity if fragment size = 3 kb |
|---|---|---|---|
| 100 ng | 600 fmol | 200 fmol | 100 fmol |
| 25 ng | 150 fmol | 50 fmol | 25 fmol |
| 1 ng | 6 fmol | 2 fmol | 1 fmol |
Table 6. Guide for the input RNA mass for varying fragment sizes and concentrations.
10. Assessing RNA quality
Chemical impurities such as detergents, denaturants, chelating agents, and high concentrations of salts should be avoided as these may affect the efficiency of enzymatic steps during library preparation. Please refer to the Contaminants document for more details.
Other contaminants such as DNA, proteins, and dyes may also reduce the efficiency of steps in library preparation.
The quality of RNA can be assessed by using a NanoDrop for samples with concentrations >20 ng/µl.
We recommend that RNA samples should have a 260/280 ratio of ~ 2.0 and a 260/230 ratio of ~2.0–2.2.
A 260/280 ratio which is lower than ~2.0 indicates the presence of DNA.
A 260/280 ratio which is lower than ~1.8 can indicate the presence of protein or phenol.
If the 260/230 ratio is significantly lower than 2.0–2.2, this indicates the presence of contaminants, and the RNA may need additional purification.
Use the Agilent Bioanalyzer together with the RNA Analysis Kits to assess whether the RNA has degraded.
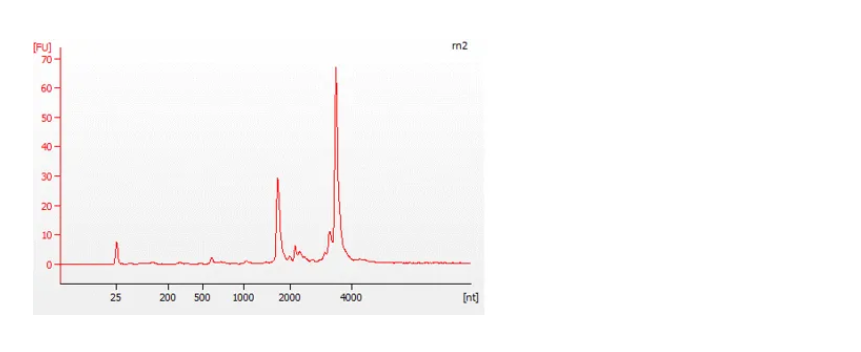
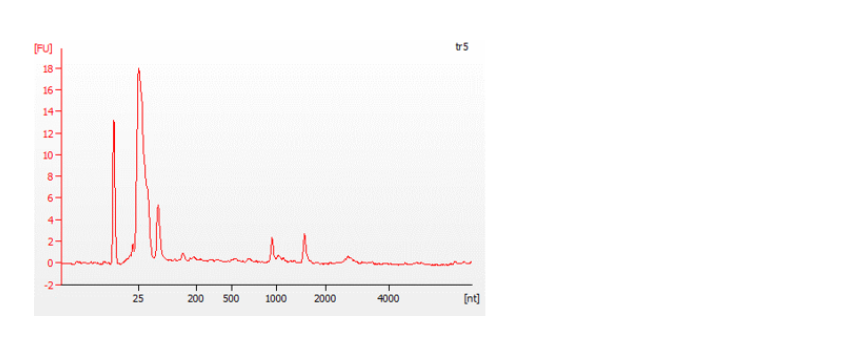
The Bioanalyzer traces below show an example of a good quality, full-length RNA sample (top) with an RNA Integrity Number (RIN) of 9.5, and a degraded sample (bottom) with a RIN of 4.5. For more information about RIN, please refer to the document on RNA Integrity Number.


Figure 7: Traces from a Bioanalyzer (Agilent) showing the quality of the RNA samples analysed.


