Q-Line GridION user guide (ONQ-GRDV2-UG_revA_20Jul2026)


Guide
V ONQ-GRDV2-UG_revA_20Jul2026
FOR RESEARCH USE ONLY.
NOT FOR USE IN DIAGNOSTIC PROCEDURES.
Contents
Introduction
Basic operation
Running an assay
- 8. Using sample sheets
- 9. Using supporting files
- 10. Setting up and running an assay
- 11. After a run is complete
- 12. General decontamination
Flow cell maintenance
Data and reports
Further information
1. Introduction
The Q-Line GridION™ is a compact benchtop sequencing system with integrated real-time data processing allowing up to five assays to be run either concurrently or individually.
This document provides guidance for laboratory use of the Q-Line GridION device. It is intended for users who are responsible for the routine operation of the device and for running sequencing assays in a laboratory environment. To carry out the operations described here, the device must be correctly installed and the user must be logged in to a user account with Laboratory user permissions.
For device and software configuration instructions, including information on managing user groups, refer to the Q-Line GridION configuration guide.
2. Product description
Intended use
The Q-Line GridION is intended for sequencing libraries prepared from native or amplified nucleic acids. It is a long and short read nanopore-based sequence analyser platform intended to generate sequence data from DNA and RNA. DNA and RNA samples can be amplified by PCR or maintained in their native state. A range of fragment lengths can be used, and they can be single or multiplexed. Signals are measured and interpreted by accompanying device software into DNA and RNA sequence information. The Q-Line GridION provides all components needed to produce an industry-standard data format (FASTQ files) that contains sequences for downstream bioinformatic analysis. The Q-Line GridION is intended for research purposes only and should not be used in diagnostic procedures. The Q-Line GridION is intended for use by trained laboratory personnel.
The Sequencing Software
The Sequencing Software carries out several core tasks: data acquisition, real-time analysis and feedback, basecalling, data streaming, controlling the device, and ensuring that the platform chemistry is performing correctly to run the samples. The software takes the raw data and converts it into reads by recognition of the distinctive change in current that occurs when a DNA strand enters and leaves the pore. It then basecalls the reads and writes out the data into FASTQ and BAM files. Additionally, some assays can run bioinformatics workflows to analyse the output sequence and provide interpretation.
3. Performance characteristics
The performance specifications of the Q-Line GridION are outlined in the table below. Specifications represent average observed performance in verification runs using samples meeting the input requirements of optimised RBK114, RPB114, and LSK114 protocols with HAC basecalling. Actual output and accuracy depend on sample quality, library preparation method, flow cell type, basecalling model, and analysis settings. Accuracy values refer to modal single-read accuracy, not consensus or assembly performance.
| Category | Specification |
|---|---|
| Single-read accuracy | 99.2–99.4% modal accuracy* |
| Typical output per flow cell | 8.0–12.5 Gb in 24 hours (chemistry and basecalling model dependent) |
| Minimum average output (barcoded runs) | ≥50 Mb per sample† when running 96 samples |
| Read length flexibility | Amplicons (approximately 1 kb) to long fragments (approximately 48 kb) |
| Typical run time | Up to 24 hours per flow cell |
| Compute and analysis | Integrated compute enabling real-time, local basecalling and analysis |
| Multiplexing capacity | 1–96 samples per flow cell‡ |
| Application scope | Plasmids, microbial isolates, amplicons, metagenomics, mRNA/plasmid QC |
| Regulated environment readiness | Designed to support 21 CFR Part 11 and EU GMP Annex 11 workflows |
| Flow cell operation | Five fully independent flow cells |
*Chemistry and basecalling model dependent
†Library dependent
‡Method dependent
4. Considerations for use
Warnings
- Follow Good Laboratory Practice in relation to personal safety, including but not limited to the use of personal protective equipment when handling the samples and test reagents. Refer to Safety Data Sheets provided with the product for specific safety requirements.
- Take care to prevent the reagents from contacting your skin, eyes, and mucous membranes.
- If contact occurs, immediately wash the affected area with soap and water. Thoroughly wash hands after handling samples and test reagents.
- Do not use a flow cell if the package has been damaged.
- In the event of a serious incident, contact the Manufacturer of the device. The user may also wish to contact the competent authority of the Member State in which the device was used.
- The Q-Line GridION as supplied provides only raw sequence data, which requires validated downstream analysis and the inclusion of assay-specific controls.
- Using the Q-Line GridION outside of the intended use is not recommended and is at the user’s risk.
Precautions
Personal protection
- Refer to local or WHO health and safety guidance for handling samples containing hazard group (HG)/BioSafety Level (BSL) 3 organisms.
- Decontaminate surfaces with 0.5% sodium hypochlorite (bleach) diluted with deionised or purified water.
- Any spillages should be disposed of appropriately in accordance with local regulations and not disposed of directly into the domestic water supply. Avoid contact with strong acids or alkalis.
Device operation
- The device must use the power supply and associated cables (as described in the Q-Line GridION configuration guide). The maximum power draw is 650 W, the maximum current is 6.5 A, and the supply voltage is 100–240 VAC (50/60 Hz).
- The device should be regularly wiped with 70% isopropanol and a lint-free cloth, or biocidal wipes. The device should be wiped before and after use.
- Maintenance of the device is not required beyond routine cleaning.
- There should be 30 cm clearance to the front, rear, top, and sides of the device.
- The back panel of the Q-Line GridION device may reach very high temperatures.
- The device is designed to operate at 18 to 25°C.
- Use of the device outside of the intended use may result in a failed run or incorrect results.
- The developer of an assay must ensure the assay definition configuration file contains an accurate estimation of output for a given assay to receive appropriate warnings about storage limitations before starting. For technical specifications of the device, refer to the Q-Line GridION configuration guide.
- For security purposes, sample sheets created and used with the Q-Line GridION should not contain any personally identifiable information.
- The user is responsible for ensuring sample sheet accuracy before use to mitigate risk of assigning results to the incorrect sample.
- When accessing data through the file browser or terminal, it is the user’s responsibility to ensure that data copied away from the /output directory is stored securely.
- Store and operate the device in a physically secure environment. When leaving the device unattended, it should be locked or user accounts should be logged out.
- Do not insert unknown USB devices into the device.
5. Starting the device
To configure the device for first use, a laboratory manager or IT administrator should refer to the Q-Line GridION configuration guide.
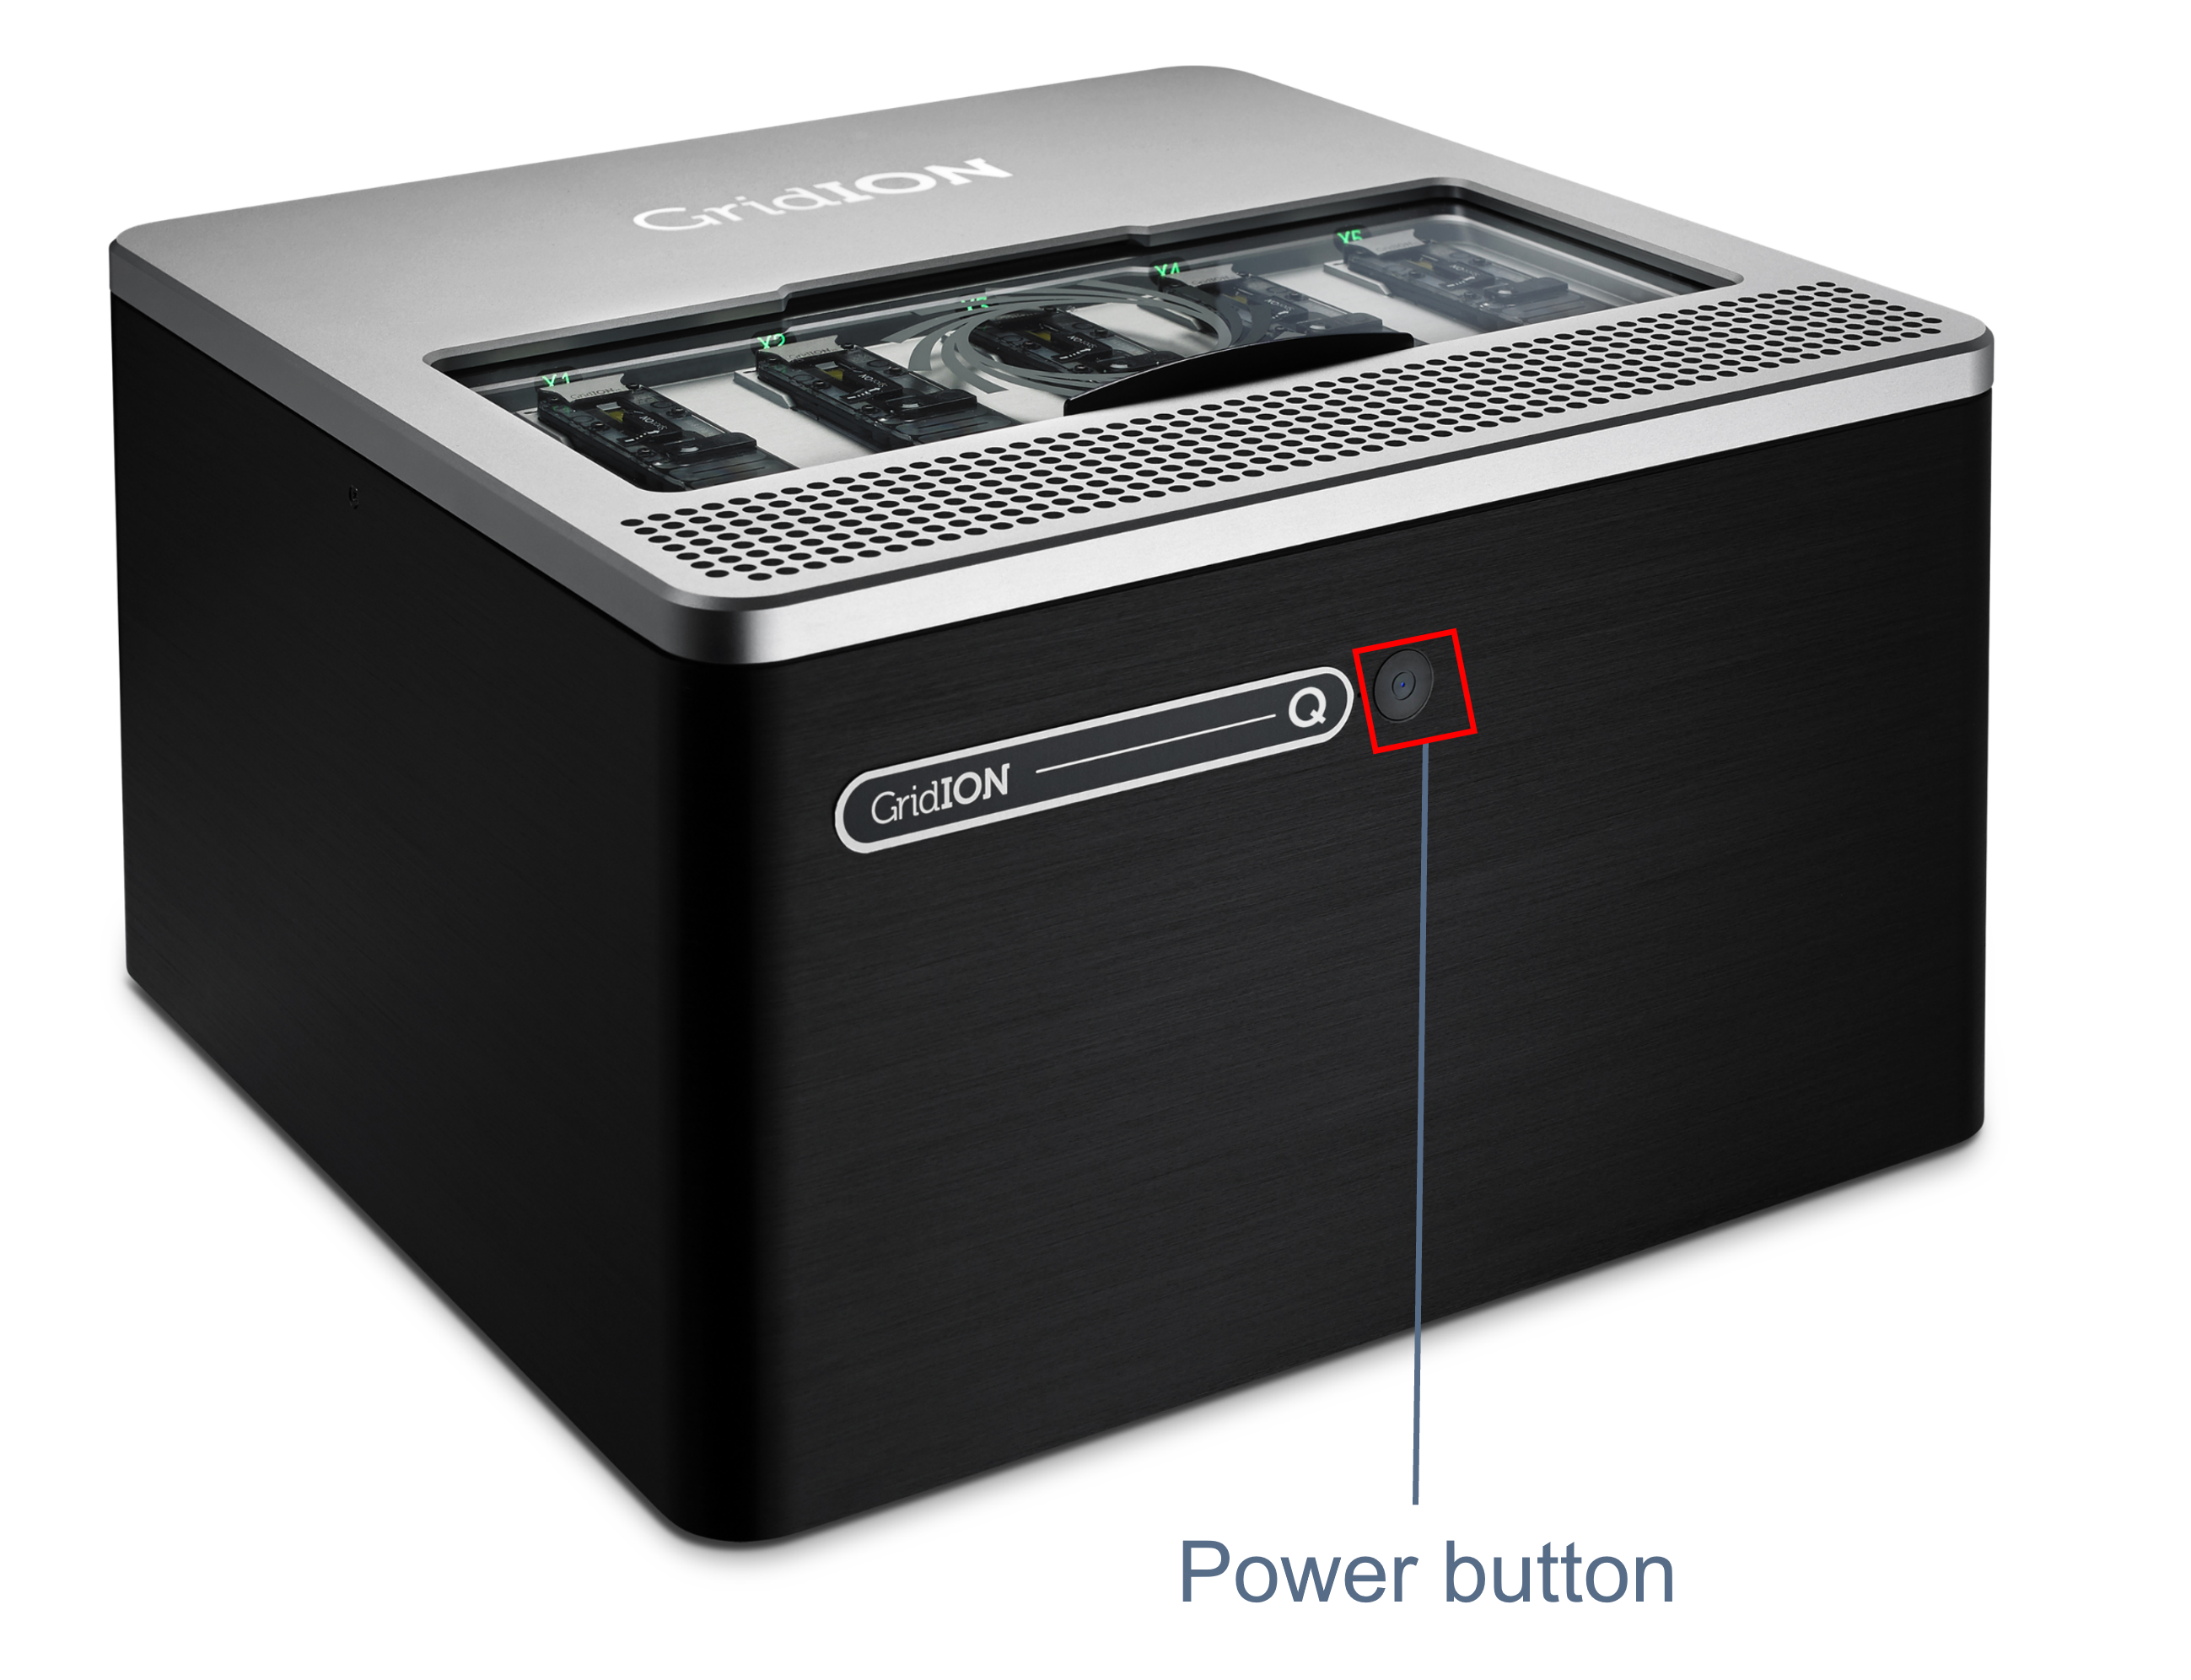
Press the power button. A blue light will appear in the middle of the button.
When prompted, enter the encryption passphrase and press Enter.
Note: This is not the same as the user password. A laboratory manager or IT administrator will set the decryption passphrase during first-time set up as outlined in the Q-Line GridION configuration guide.

At the lock screen, press any key or click to unlock.
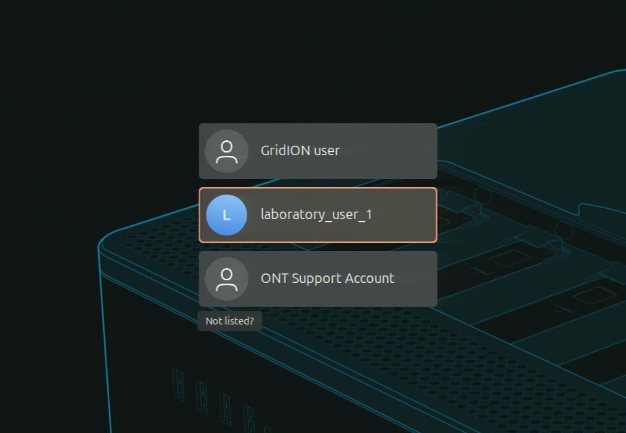
At the Ubuntu login screen, click your user account.
A laboratory manager or IT administrator will need to set up user accounts for laboratory users. More information can be found in the Q-Line GridION configuration guide .
Enter your account password.
The password for your user account should be provided by a laboratory manager or IT administrator.
You may be required to change your password when you log in for the first time. Refer to the Changing your password section of this guide for information on password requirements. 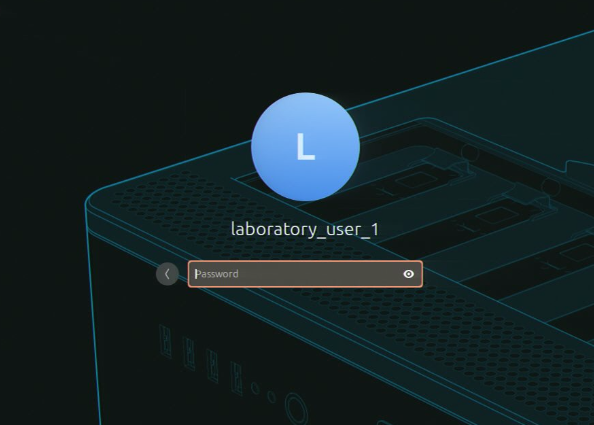
In the sidebar, click the Sequencing Software icon.
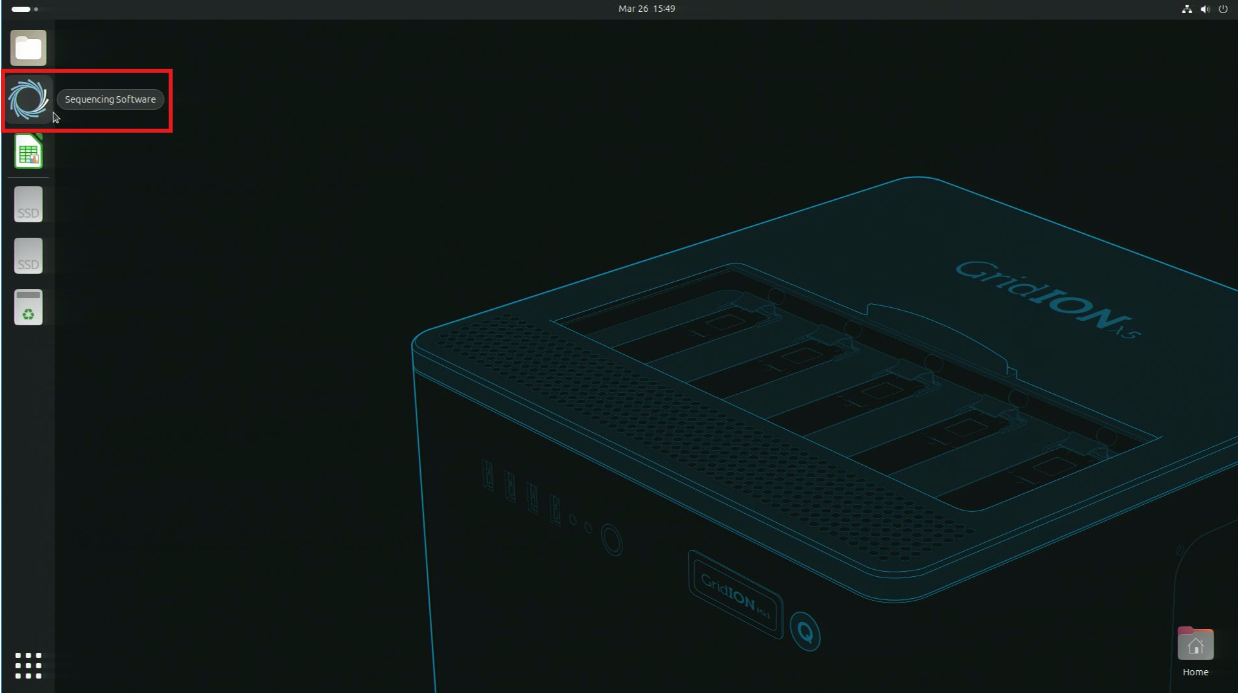
The Position overview page will be displayed. The overview shows the five flow cell positions and their current status. 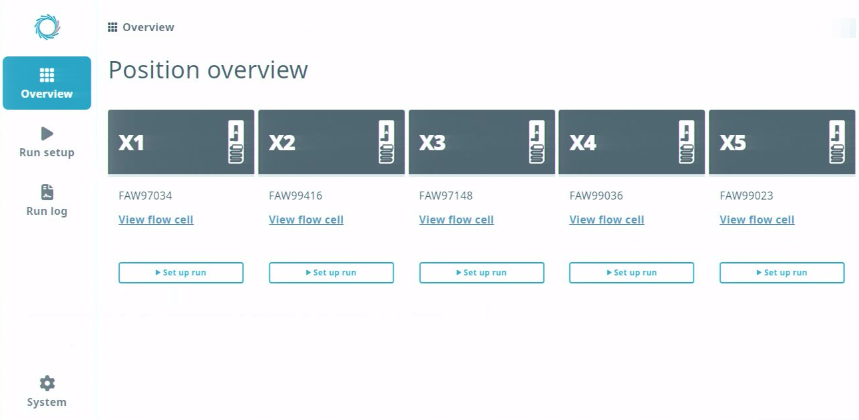
From this page, you can begin the following tasks: set up a run, view in-progress or completed runs, manage the device, or view details for live positions.
There are four buttons on the left side:
- Overview: The overview includes the five GridION positions and their current status. From this page, it is possible to set up an assay through the Set up run buttons.
- Run setup: The run setup opens to the assay selection. It shows the five stages of setting up a run.
- Run log: The run log contains all your completed runs.
- System: This section includes information on device storage and language settings. Some system settings are only available to users with Laboratory manager or IT administrator permissions.
6. Changing your password
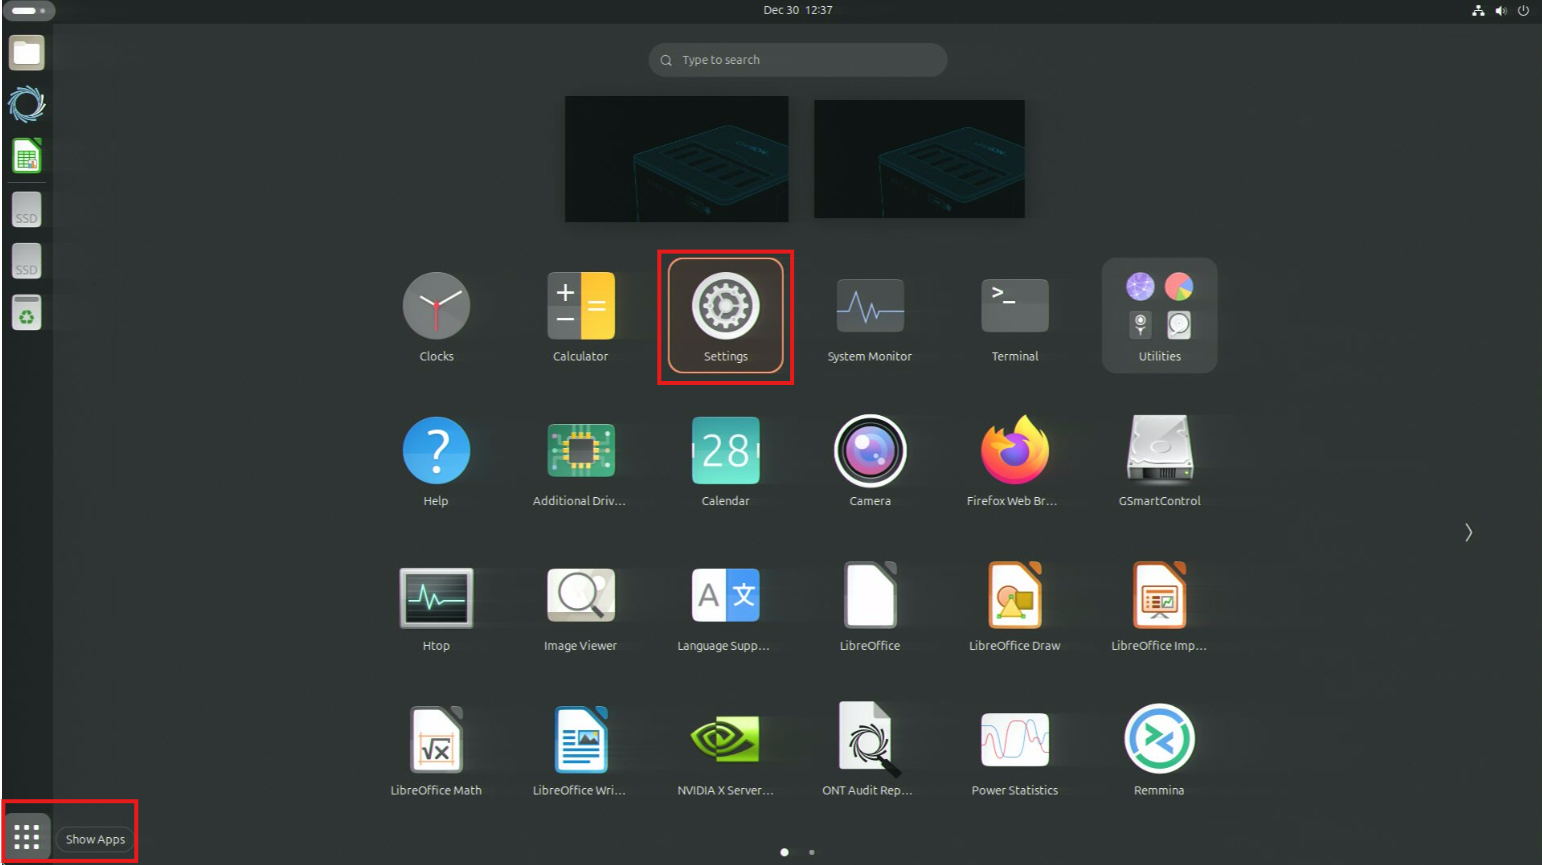
Click Show Apps in the bottom left of the desktop, and then click Settings.
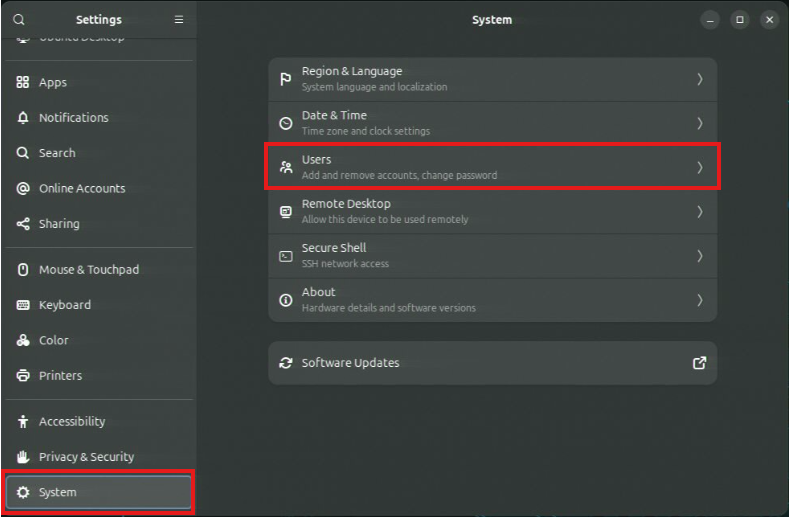
In the Settings window, click System in the menu on the left, and then click Users.
Click Password.
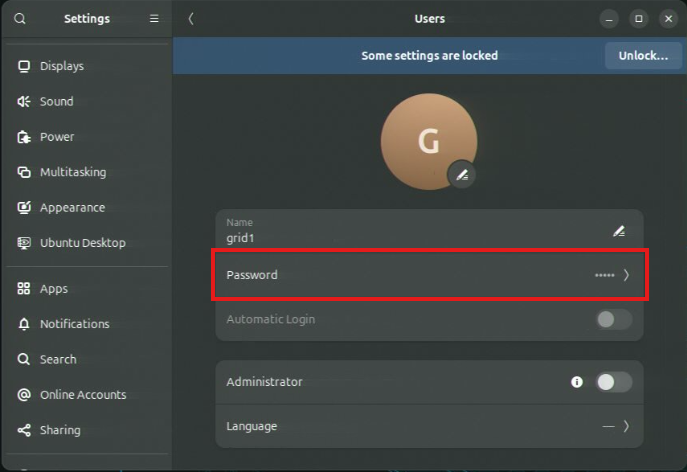
Enter the current and new passwords in the relevant fields.
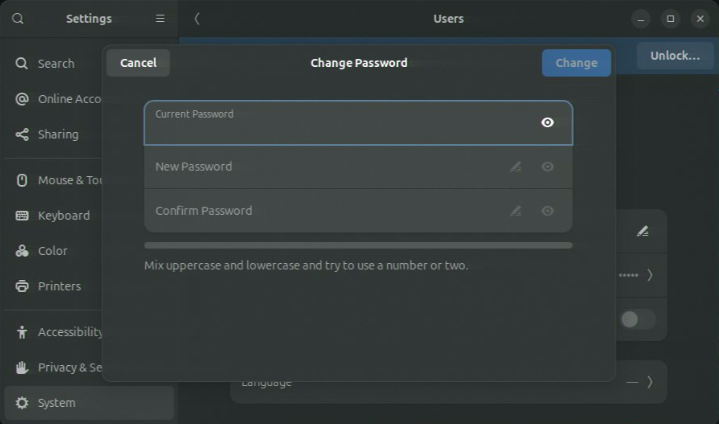
Passwords must meet the requirements listed below:
Note: IT administrators will be able to change these complexity requirements.
- You can use numbers, letters, upper/lower case and punctuation.
- The minimum password length is eight characters.
- You cannot have a password that is a palindrome (reads the same backwards and forwards, e.g. “racecar").
- The new password cannot be the same as the previous one, even if you have changed the cases.
- The new password cannot be the rotated version of the old password (e.g. "billy" and "illyb").
- Multiple character groups must be included in the new password.
- The password must contain at least one character from three of four character groups: digits, lower case alphabetic characters from the current system locale, upper case alphabetic characters from the current system locale, and other characters (e.g. punctuation marks and symbols such as * % ! ?)
For local users where there is no distinction between upper and lower case (i.e. most Asian scripts), the two groups are treated as one.
7. Shutting down
Save all work and close any open applications.
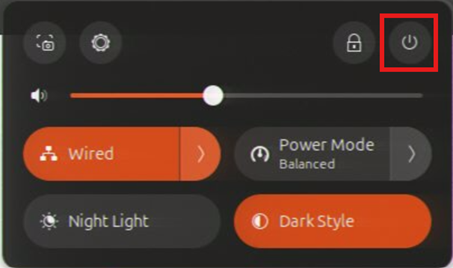
Click the system menu in the top right corner of the desktop.

Click the power icon.
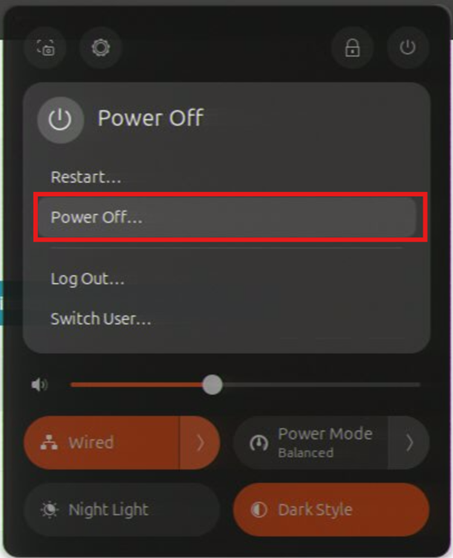
From the menu, select Power Off…
8. Using sample sheets
When setting up an assay run, you will need to provide a sample sheet. This details sample information and can include barcodes used, corresponding sample IDs, and sample types. This is a vital traceability link, and strict validation rules are applied to minimise the risk of data entry errors.
You can create sample sheets on the Q-Line GridION using LibreOffice Calc, which is installed on the device. Alternatively, you can create sample sheets on another device and transfer them onto the Q-Line GridION via a USB drive. Refer to the Mounting a USB storage device section for more information. Do not insert unknown USB drives into the device.
Alternatively, you can use a laboratory information management system (LIMS) to add information to your sample sheet automatically. The GridION and LIMS must be configured before library preparation, as detailed in the Q-Line GridION configuration guide.
For security purposes, sample sheets created and used with the Q-Line GridION should not contain any personally identifiable information.
Manual input
Sample sheets can be written manually using LibreOffice Calc or other similar programs which can save files in .csv format. The sample sheet template should be used when manually creating a sample sheet.
LibreOffice Calc is installed on your Q-Line GridION. The following steps describe how to use it to generate a sample sheet.
To locate templates in LibreOffice Calc, click File in the top menu bar, select New from the dropdown menu, and then click Templates....
Open the template for the assay sheet in LibreOffice Calc.
Edit the template for the samples you are running.
Save the sample sheet in your local folder. In the Save dialog, use the drop-down menu in the bottom-right to change the file type to be Text CSV (.csv) and then click Save in the top-right of the dialog.
You are now ready to import the sample sheet when setting up an assay, as described in the Setting up and running an assay section of this guide.
Template format
Templates are available as .ods files on your Q-Line GridION.
| Keys | Description |
|---|---|
| v2 (above header section) | Version of the sample sheet format (Do not change this) |
| assay | Assay key installed on the UI and its version. Must be in the format key:version where key and version are defined in the assay definition file |
| sample_sheet_name | Provided by you to identify the library for sequencing. Use letters, numbers, full stops (.), underscores (_) or hyphens (-); spaces may be used at the end. Important: Do not add any personally identifiable information in this field. |
| sample_count | Number of samples used. This must match the number of barcodes used, including samples and controls. Note: Using the template will automatically calculate this from the barcode/sample section. |
| created_by | (Optional) User who prepared the library. Use letters, numbers, full stops (.), underscores (_) or hyphens (-); spaces may be used at the end. |
| lot | The kind of item, and the unique ID for lot used. |
Barcode/sample section
| Keys | Description |
|---|---|
| barcode | The barcode used during library preparation for the sample. Important: If you are not using barcoding, you will not have the barcode column and will only have a sample count of 1. |
| library_id | Provided by you to identify individual libraries produced. Note: Do not add any personally identifiable information in this field. |
| sample_id | Provided by you to ID individual input samples. It must be unique within the assay. Note: Do not add any personally identifiable information in this field. |
| sample_type | The type of sample. This will take one of several values depending on the assay you are running and these are available from a drop-down menu in a template |
Note: The sample sheets for some assays may require additional columns which will be outlined in the assay documentation.
Example
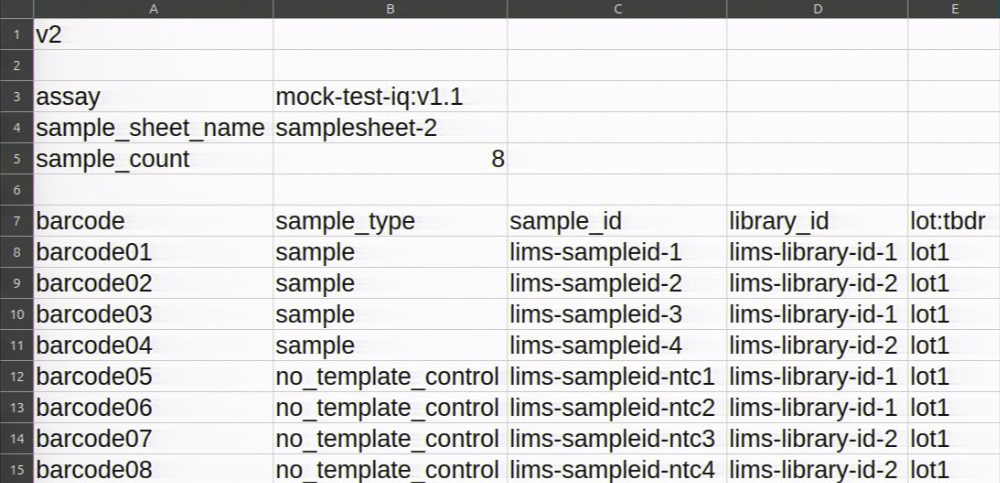
The table below shows the sample sheet for an assay using the Rapid Barcoding Kit.
Note: Empty rows must be preserved in your own sample sheets. A failure to do so will invalidate the document.
9. Using supporting files
A supporting file is any file required to enable a sequencing run or downstream analysis. Examples include alignment reference files, BED files for adaptive sampling, and configuration files for analysis workflows.
Refer to the protocol for your specific assay for details on required supporting files. Additional information is provided in the Q-Line GridION configuration guide.
You can add supporting files before or during run setup. This section describes how to do this before setting up a run.
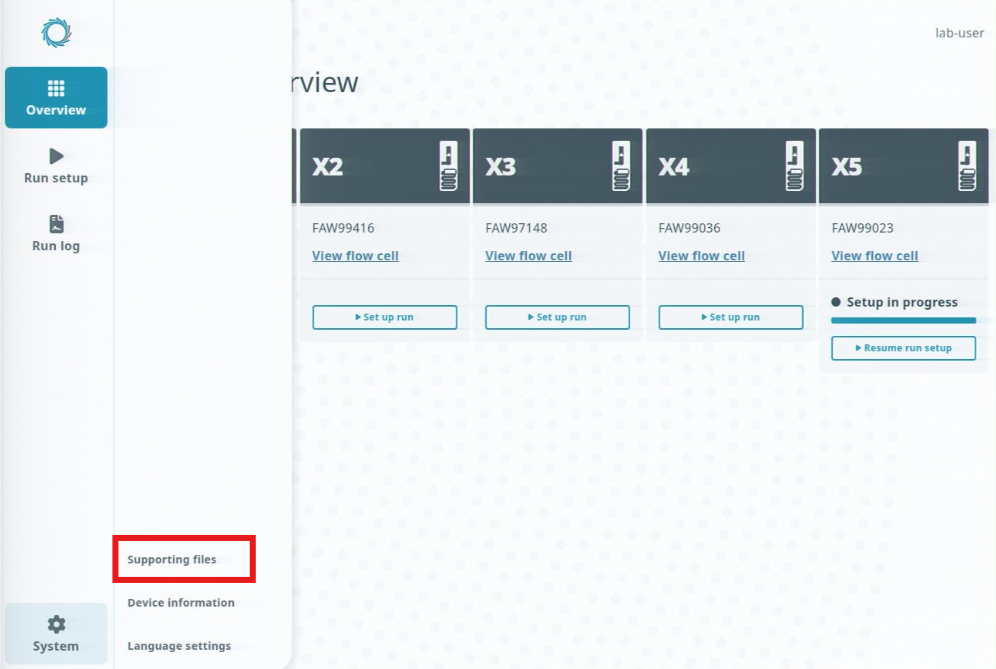
In the Sequencing Software, open the System menu and click Supporting files.
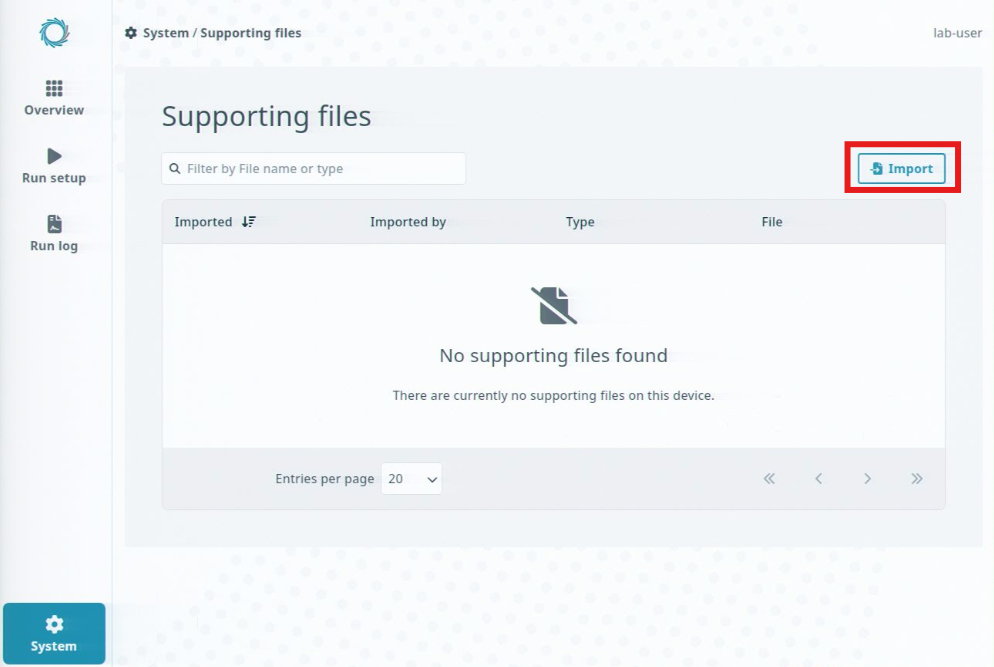
Click Import.
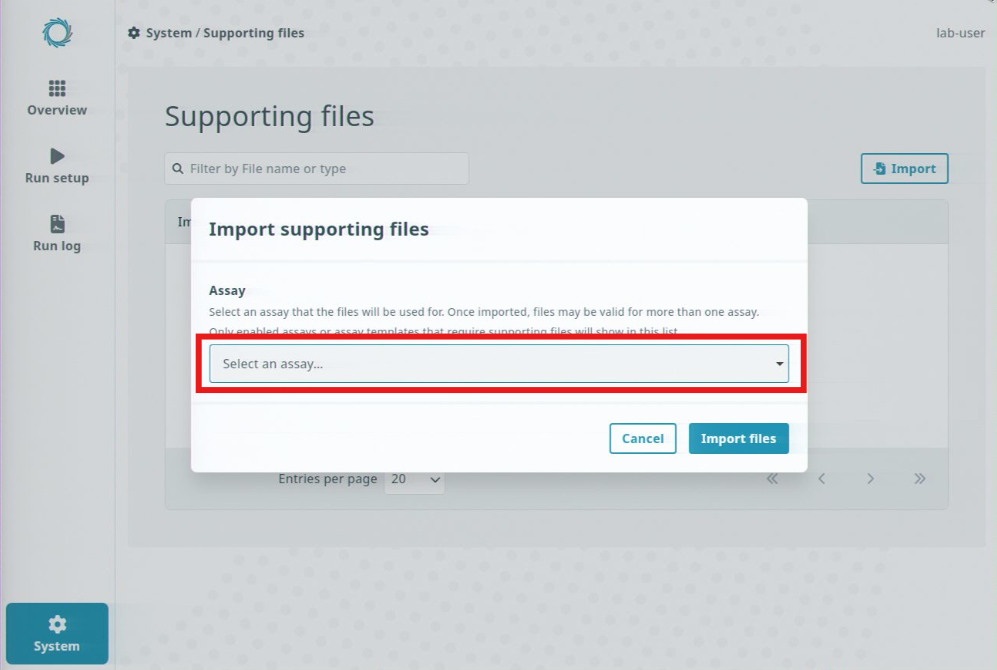
Click Select an assay, and select an assay from the drop-down menu.
Refer to the Q-Line GridION configuration guide for instructions on adding assay definition files to your device.
Click Select a file and locate your supporting file in the file browser.
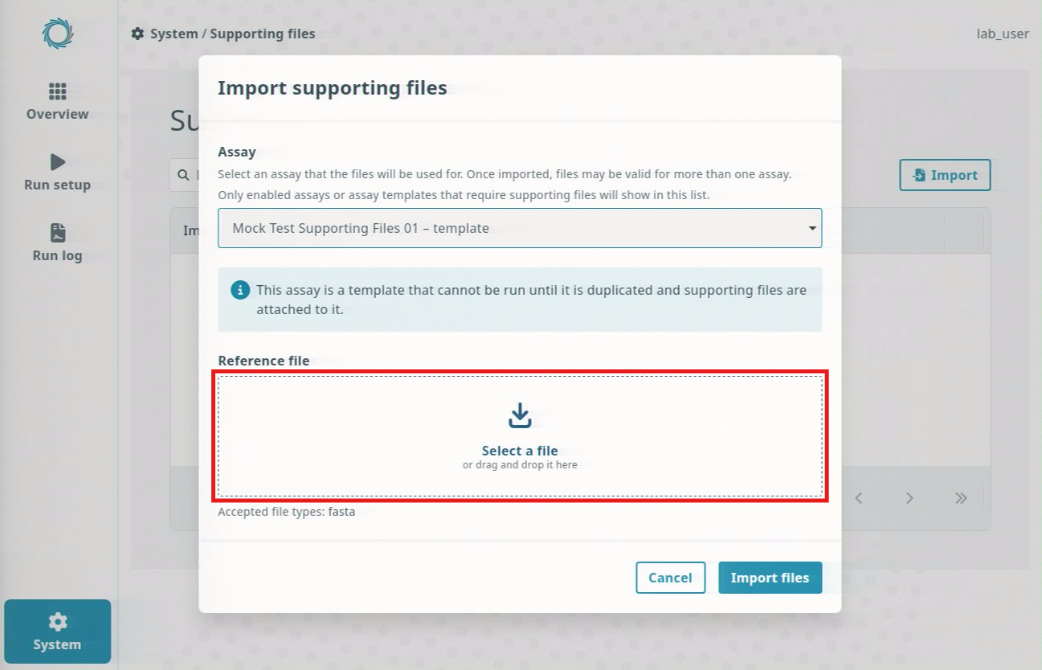
Files can also be dragged and dropped into the software window.
The type of supporting file that is accepted will be indicated at the bottom of the window.
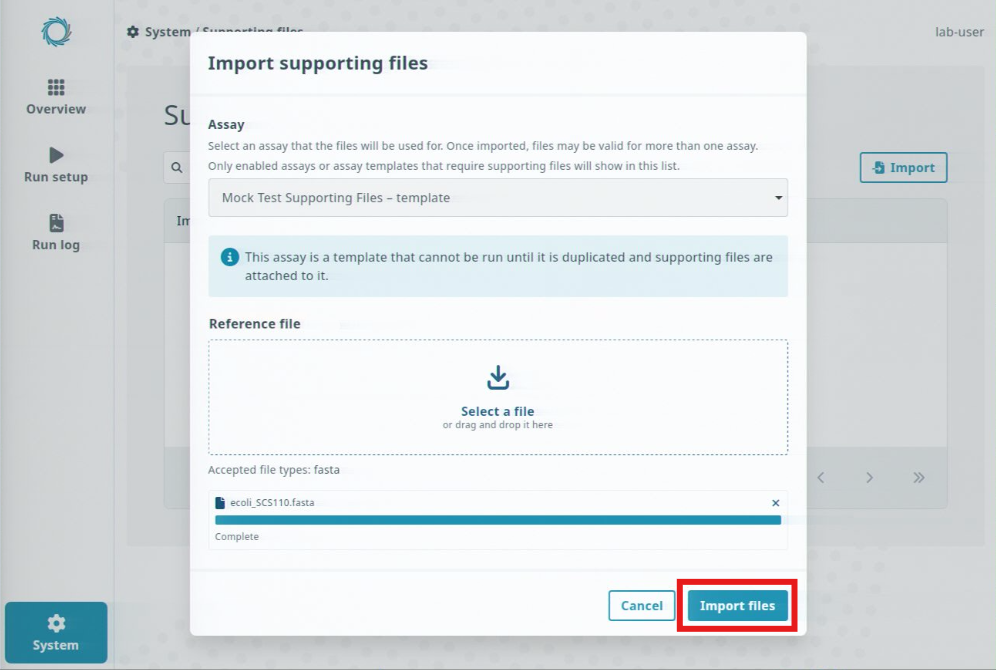
Once the loading bar indicates that the process is complete, click Import files.
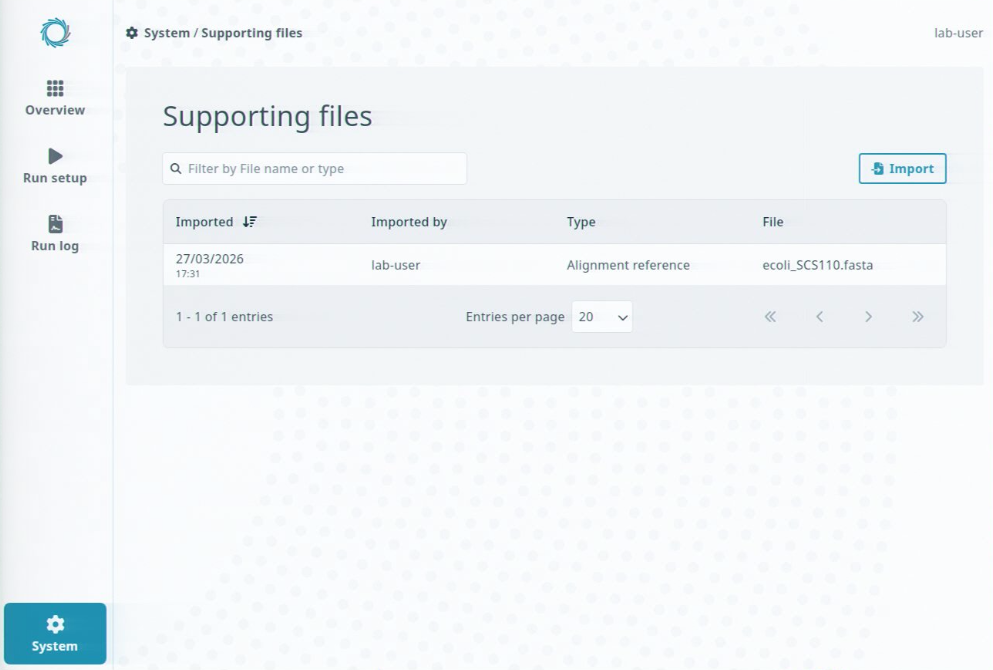
The imported supporting file(s) will be shown in the list on the Supporting files page.
10. Setting up and running an assay
This section explains how to set up and run your assay. We will use the Rapid Barcoding Kit assay as an example, and will guide you through selecting your assay, adding a sample sheet, performing a flow cell check, and initiating your run. This functionality is available to Laboratory user and Laboratory manager accounts.
Click Overview to see the five flow cell positions, and then click Set up run on the position you would like to use.
You can also click Run setup in the sidebar.
Note: The Set up run option is only available if flow cells are inserted and available for use. 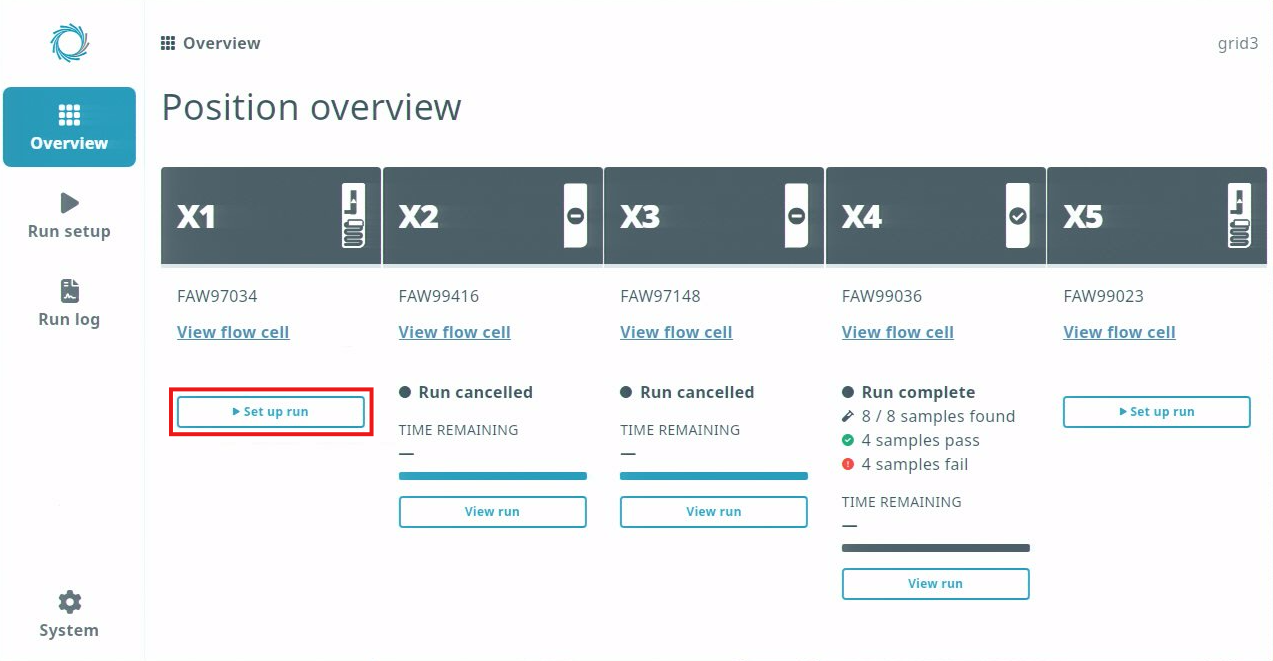
Choose the Rapid Barcoding Experiment assay, and click Continue.
You can also add custom assays to this list; the method to generate a custom assay is described in the Q-Line GridION configuration guide. 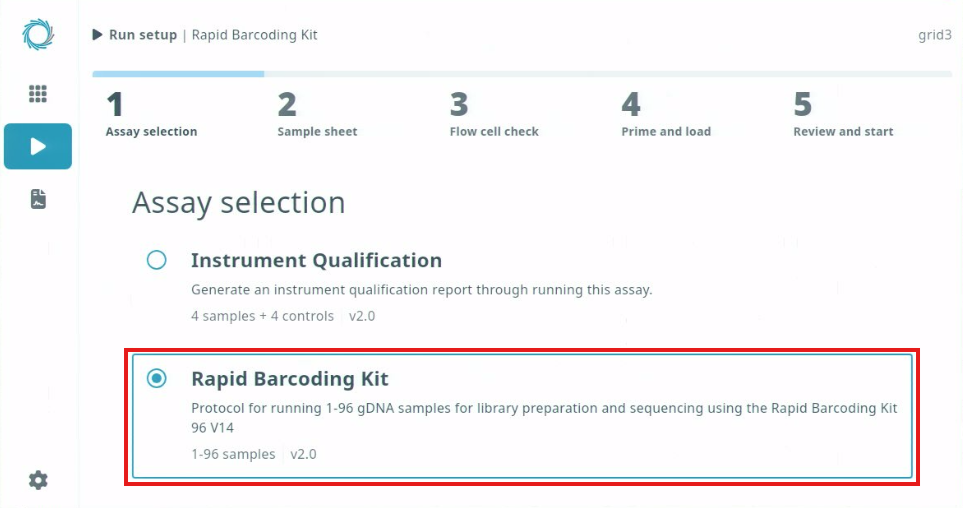
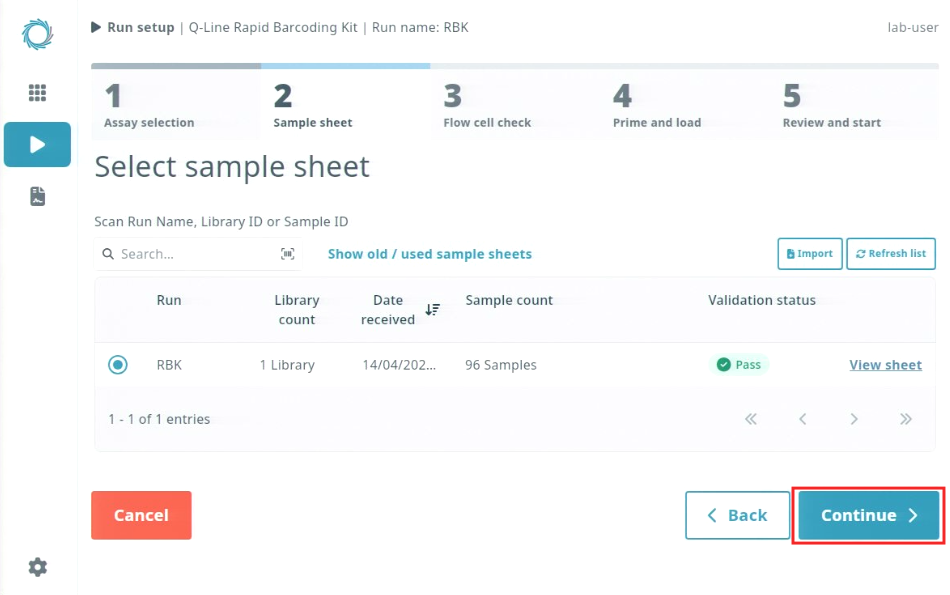
Select the sample sheet that you want to use, and click Continue.
You can only select sample sheets that have a Validation status of Pass. If the sample sheet you want to use has a different status, click View sheet for more information. You may need to use a different flow cell.
Tip: If you have a barcode scanner plugged into the Q-Line GridION, you can scan a barcode for the Library ID of the sample sheet you want to use and filter the list to only display the matching sample sheet. If your sample sheet is not already displayed, you can create and upload one. The method for creating a sample sheet can be found in the Using sample sheets section of this guide.
To manually upload your sample sheet, click Import and then click Select a file or drag and drop a sample sheet file into the Import sample sheet window. 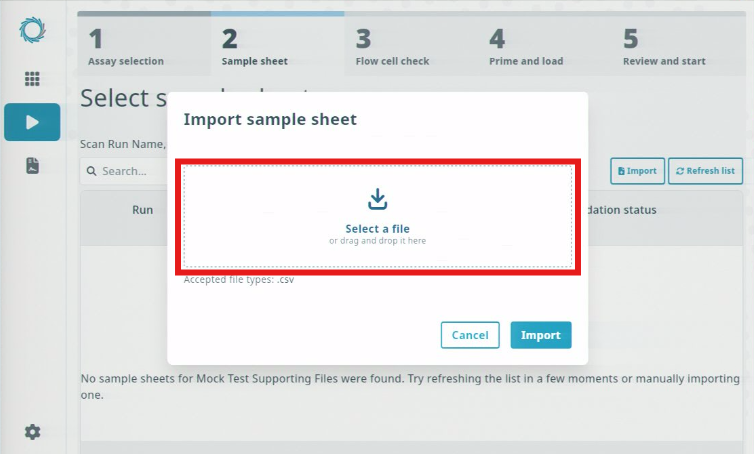
Ensure the correct sample sheet is selected.
We recommend matching the IDs on the tubes containing the final libraries to the IDs in the sample sheet and adding libraries to the sequencing device one at a time.
If your sample sheet has issues to resolve or requires supporting files, the software will indicate what is needed. When any issues are resolved, click Import to continue.
The software will check whether the sample sheet meets the requirements. If your sample sheet has an issue, an error message will indicate which part of the sample sheet does not match the required criteria.
If additional supporting files are required by the sample sheet you have imported, this will be indicated on the screen. To manually upload supporting files, click Select a file or drag and drop a sample sheet file into the window. 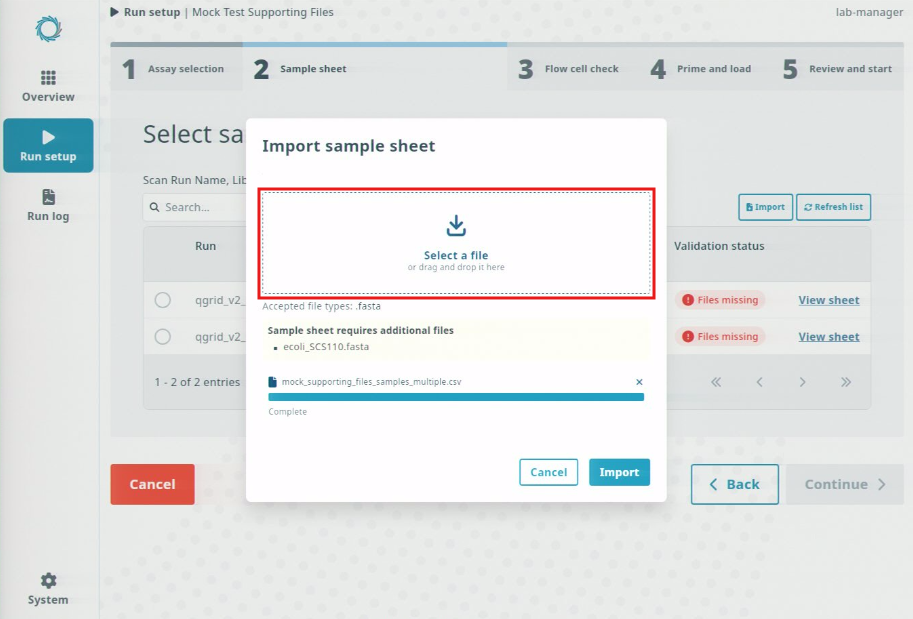
If there are no issues with the sample sheet, and any required supporting files have been added, click Import.
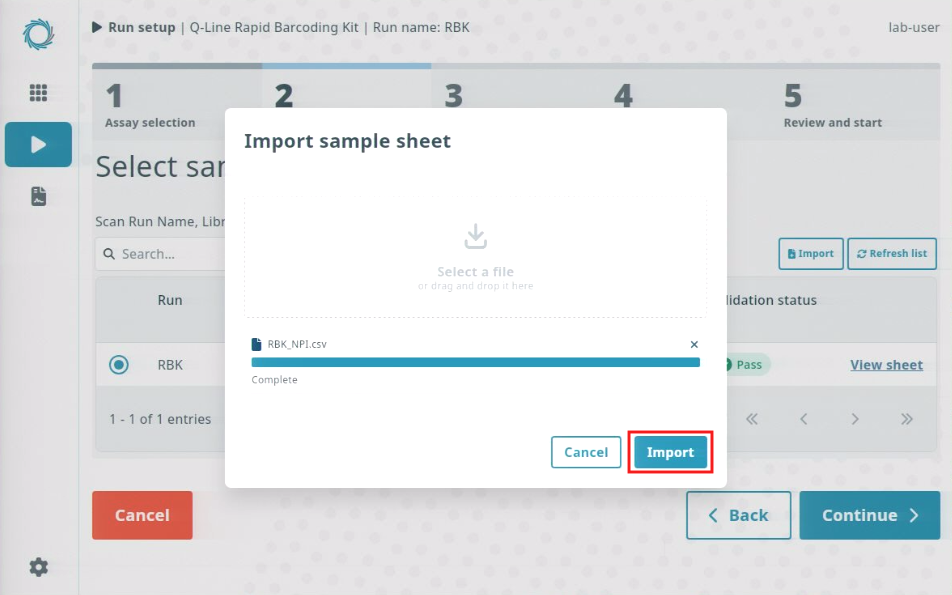
When you have a valid sample sheet loaded and selected from the list, click Continue.
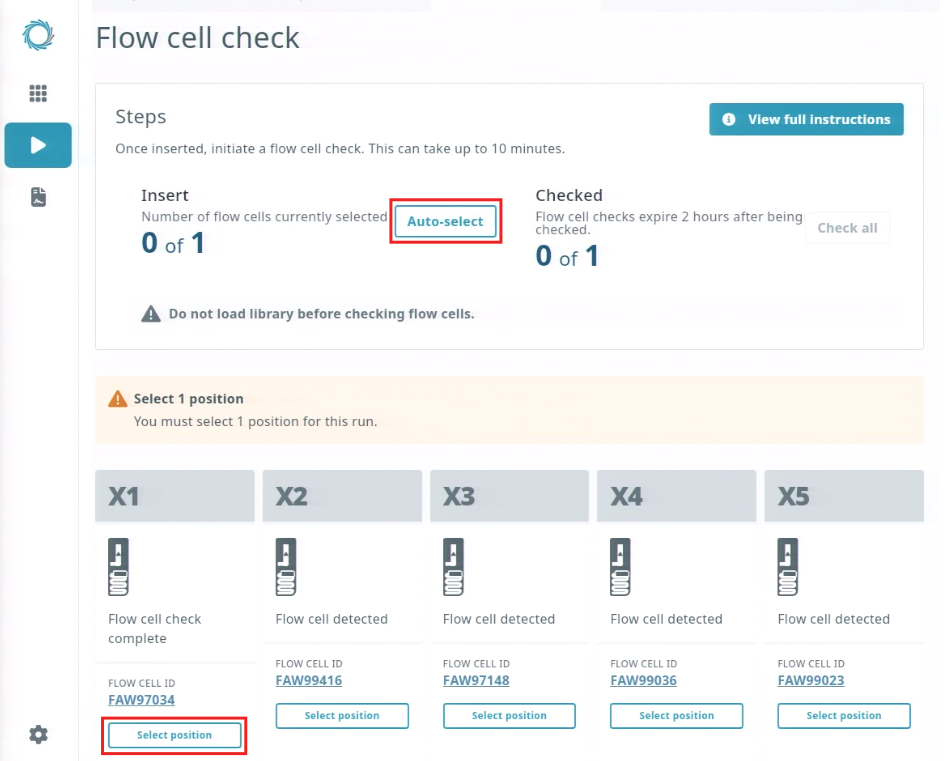
Select the flow cell(s) you would like to use.
Click Select position under the flow cell position you would like to use, or click Auto-select to automatically select the required number of flow cells.
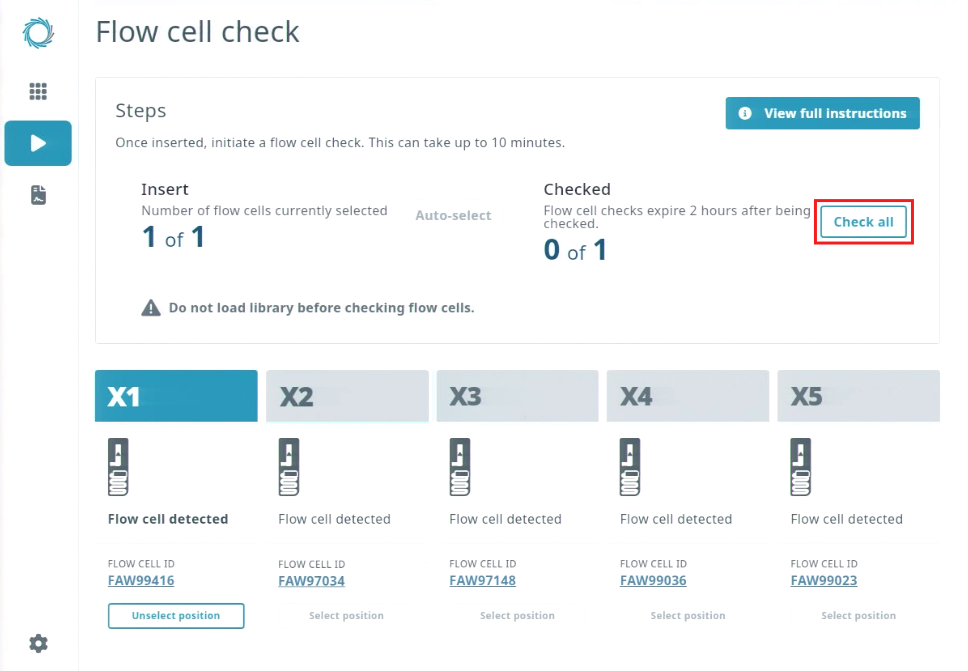
When the required number of flow cells have been selected, click Check all to start the Flow cell checks.
A status bar will show the progress of the flow cell check.
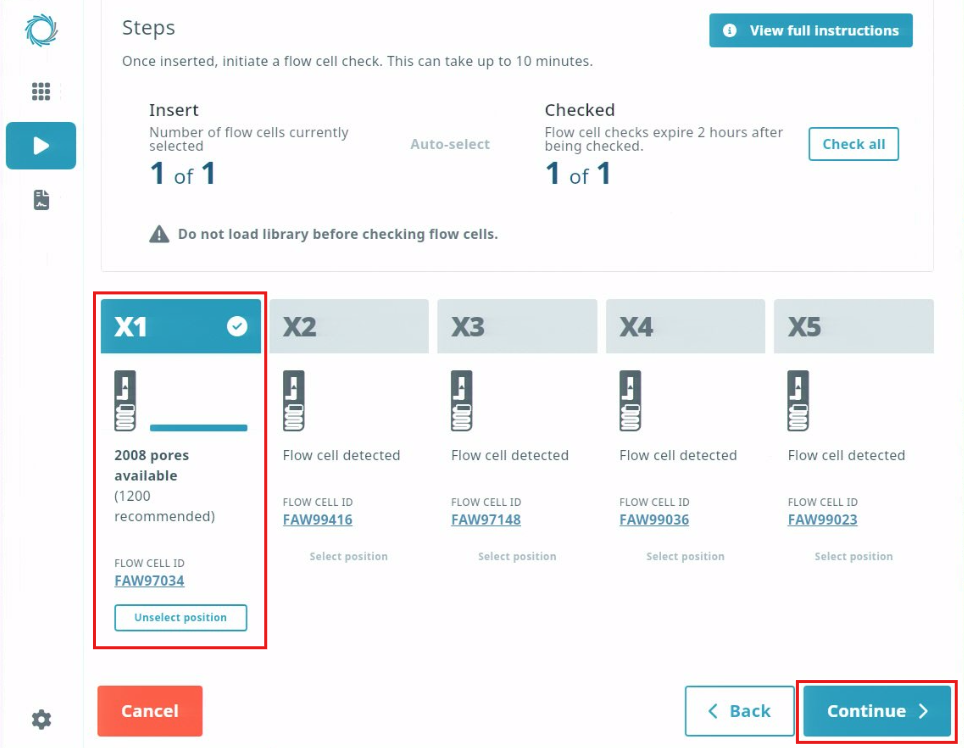
Once the flow cell check has finished, the software will report the number of pores available. If the flow cell(s) have passed the check, click Continue to move to the next step.
The outcomes from a flow cell check are outlined below. If your assay uses multiple flow cells, all will need to meet the required criteria.
- Pass - the flow cell check has detected sufficient flow cell health for the assay to generate enough data.
- Low flow cell health - the flow cell check has detected insufficient flow cell health for the assay to generate enough data for a successful run. Depending on your assay, you might be able to proceed at risk. In some cases, low flow cell health may be caused by poor thermal contact between the position and the flow cell. In these cases, on-screen instructions will direct you to reinsert the flow cell and try again.
- Flow cell depleted - the flow cell check has detected very poor flow cell health and the flow cell cannot be used for the assay.
- Flow cell check failed - the flow cell check failed to run to completion and therefore detect any pores. If this is the first failure, reseat the flow cell and try again. If this does not resolve the issue, you may need to try another flow cell and/or position.
Note: If your flow cell check is performed before the first sequencing run and fewer than 800 pores are detected, you may be eligible to receive a replacement under warranty.
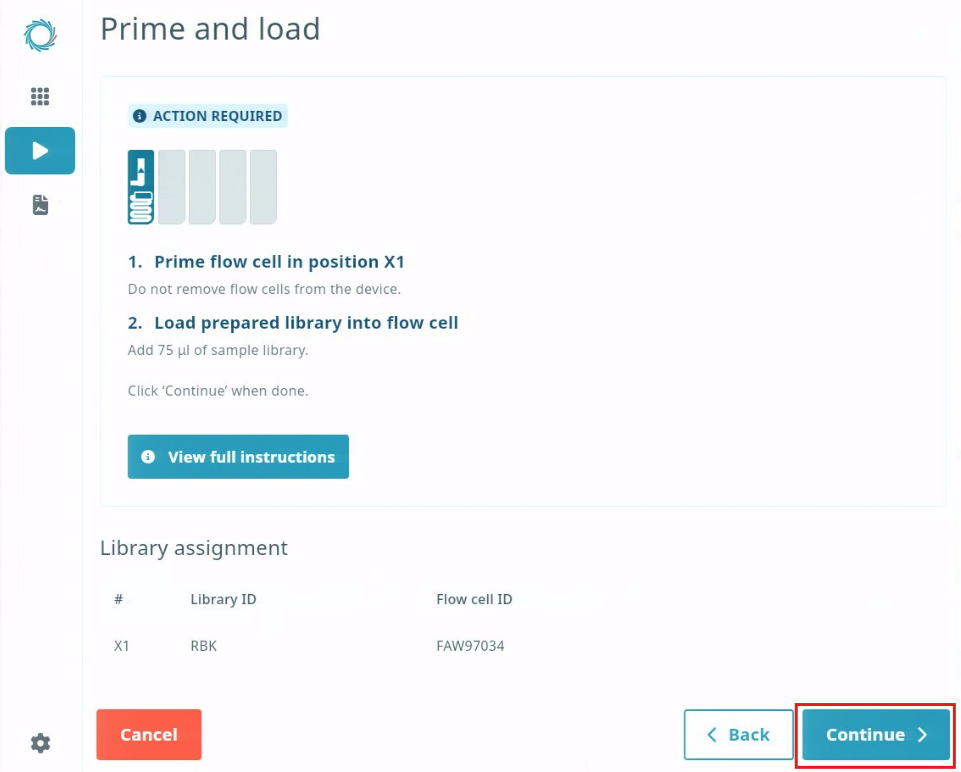
Prime and load your flow cell.
Detailed instructions for this can be viewed by clicking View full instructions, or can be found in the library preparation protocol for your assay.
Once you have loaded your library, click Continue.
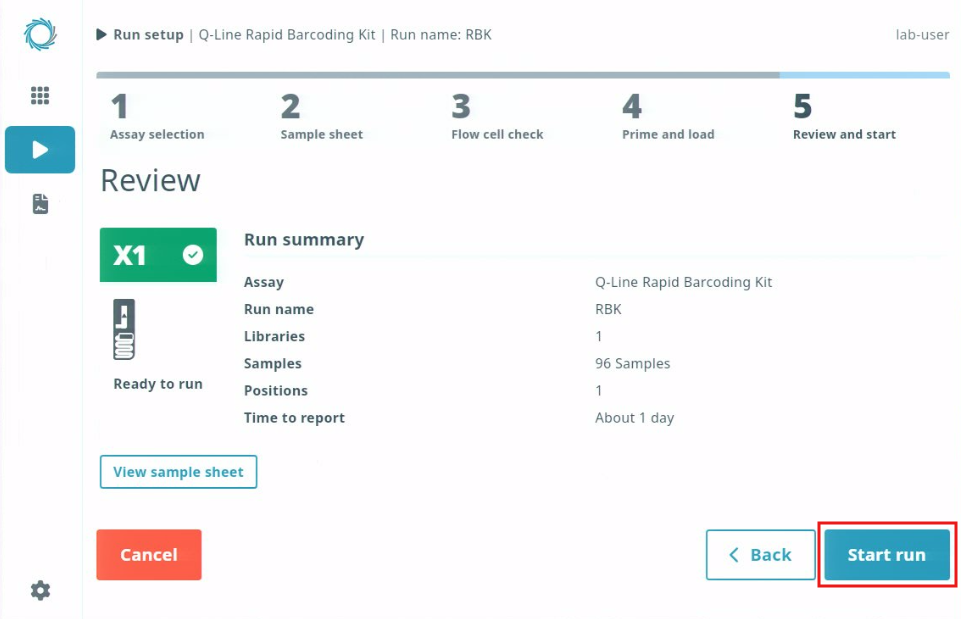
Review the assay, libraryID, number of samples, and time to report and check your sample sheet. When you are ready to proceed, click Start run.
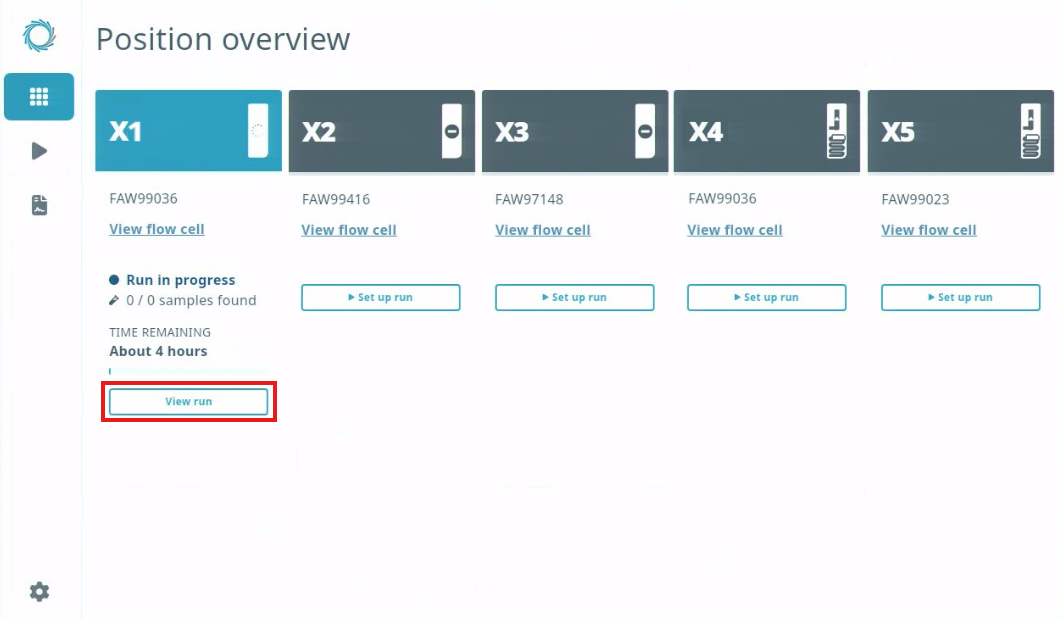
A prompt will appear in the bottom right corner indicating that the run has started. If you did not mean to start it, click Undo within 30 seconds, and the run will not start.

Click View run to monitor the status of your run.
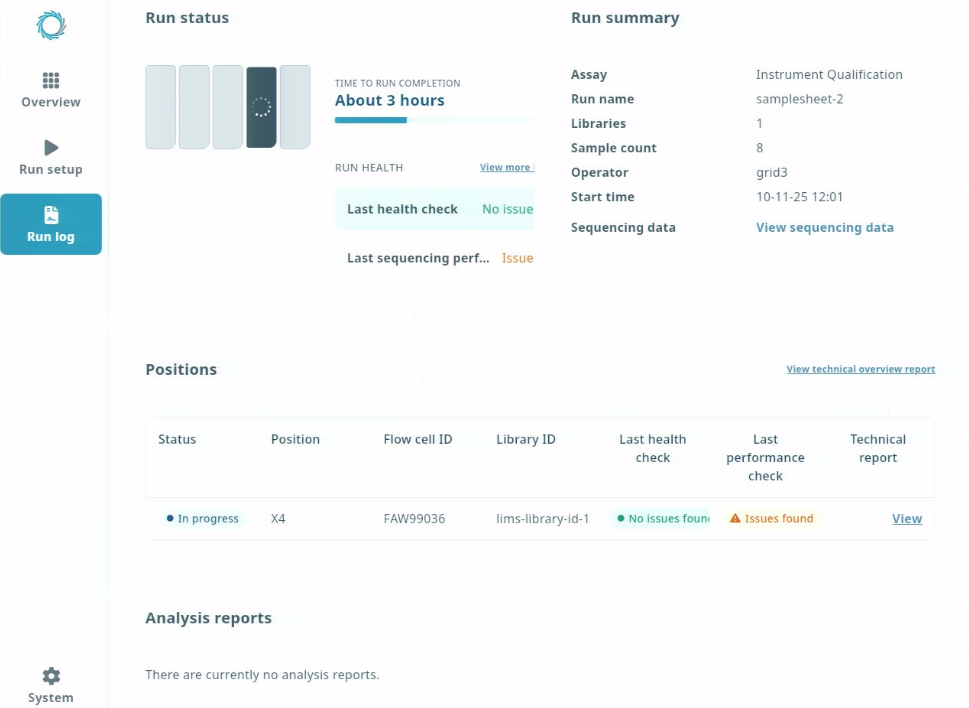
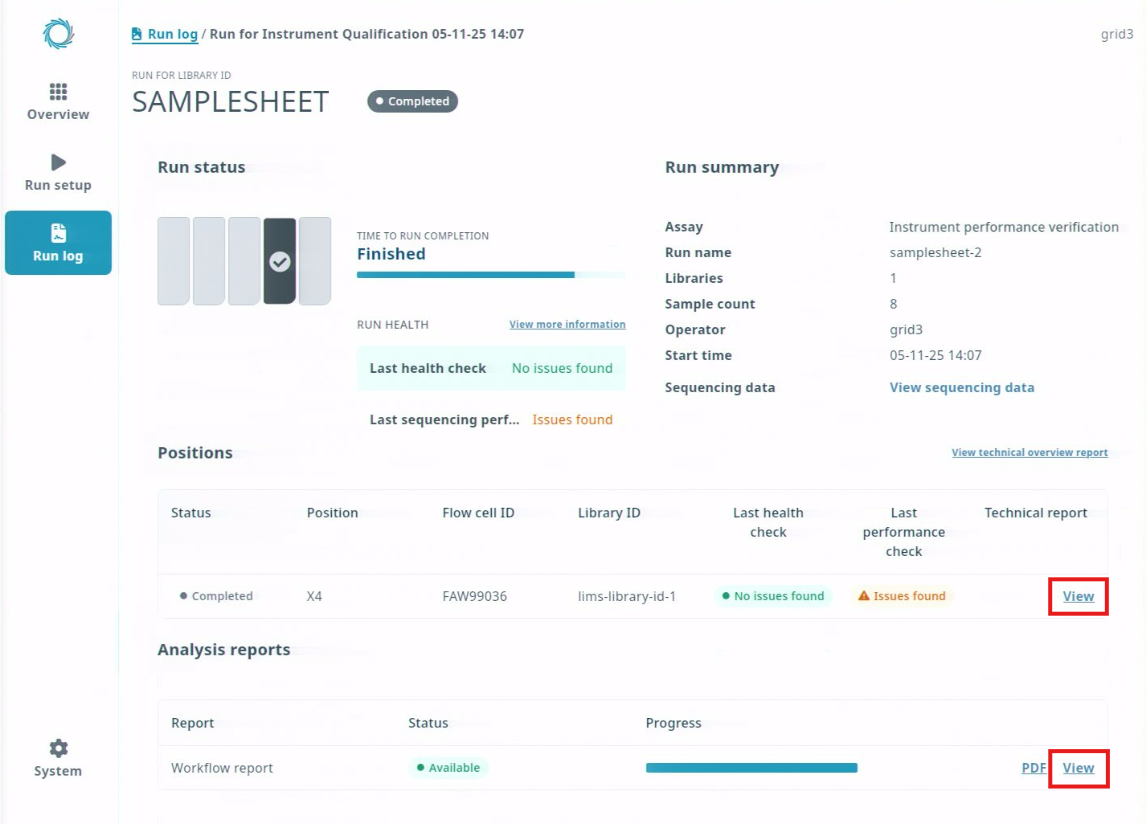
The View run button will open the Run log screen for a particular position, where five panels are displayed: Run status, Run summary, Positions, Analysis reports and Samples.
- Run status: displays information about run health and the estimated time to run completion or other upcoming event, or the amount of time a run has been paused.
- Run summary: summarises the configuration of the run.
- Positions: provides detail of the position, including Flow cell ID, Library ID and access to the technical run report. The technical run report can assist with troubleshooting if any issues occur with your run.
- Analysis reports: provides access to any analysis reports available.
- Samples: provides details of the samples in your run and access to the sample sheet. If you have barcodes, you can also check whether individual sample barcodes are found.
Do not remove a flow cell when a run is in progress.
If a run is cancelled, it cannot be resumed and any integrated analysis will not be performed.
11. After a run is complete
After the run finishes, click Run log in the sidebar to view the run summary, run status, analysis reports, and information on the samples and positions.
Click View on the right side of the Positions and Analysis reports sections to access Technical run reports and Analysis reports.
The Technical run report contains information relating to the sequencing performance of your run, including a variety of graphs and statistics. These are useful for troubleshooting and quality control. For detail of the information in this report, refer to the Technical run report section.
Note: Additional reports (in PDF or HTML format) will appear in the Sample ID list if an analysis was available for your assay.
You can save the reports as HTML files by clicking Save a copy in the top right corner of the report screen.
Example: Technical run report 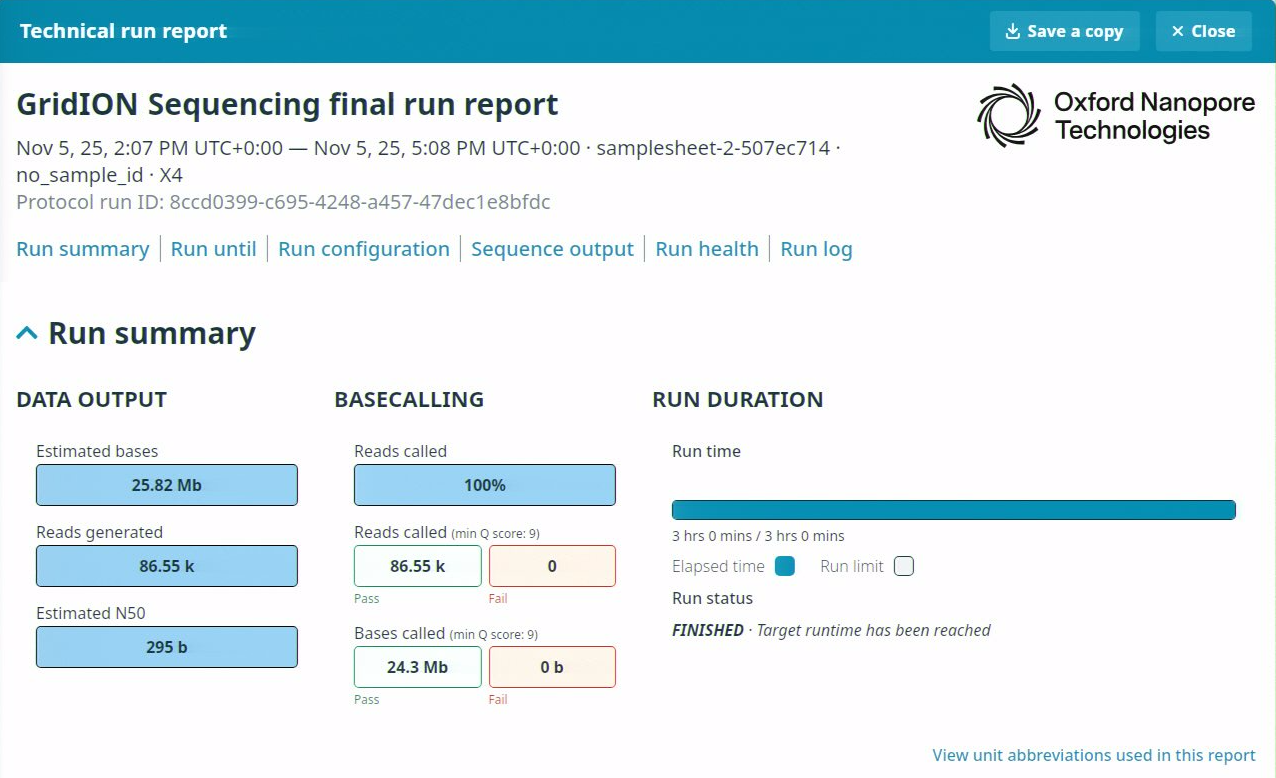
Example: Analysis report 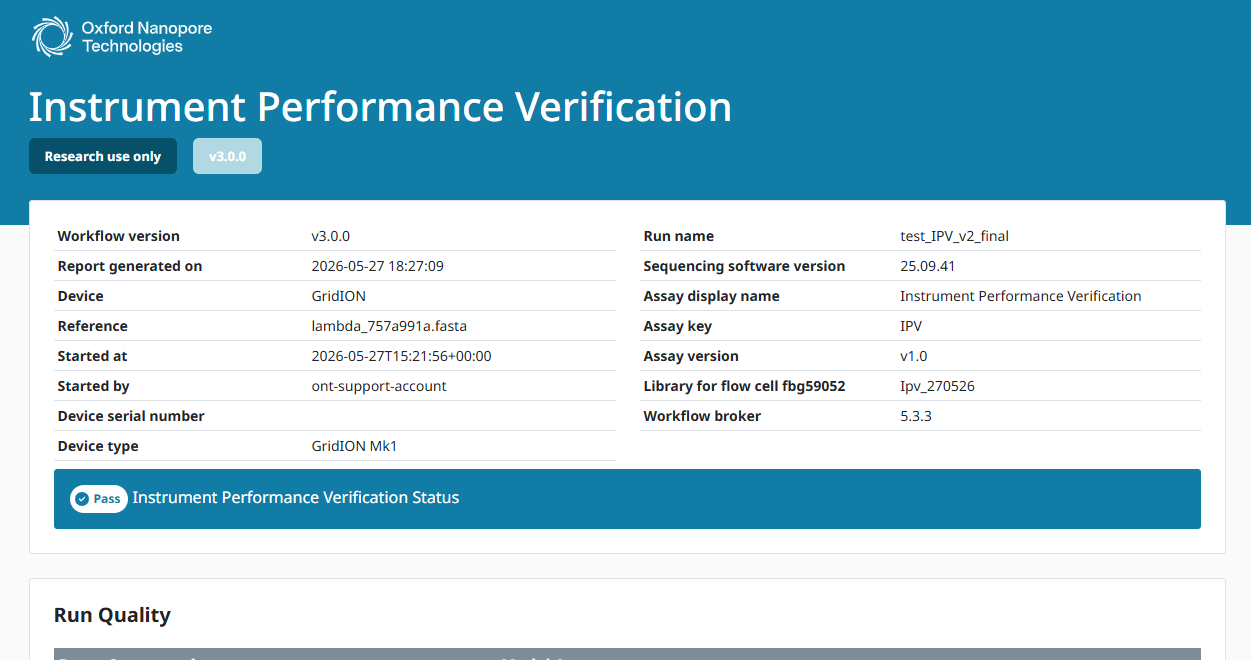
For multi-position runs, click View technical overview report to access a report containing information on all positions in your run, including the status of each position, sequencing output, and run logs.
12. General decontamination
Safely discard unused reagents, waste material, and samples in accordance with local regulations.
Decontaminate surfaces with 0.5% sodium hypochlorite (bleach) diluted with deionised or purified water.
13. Flow cell checks
The instructions below explain how to check a flow cell independently of a run. If you are setting up a run, the flow cell check must be performed as part of run setup.
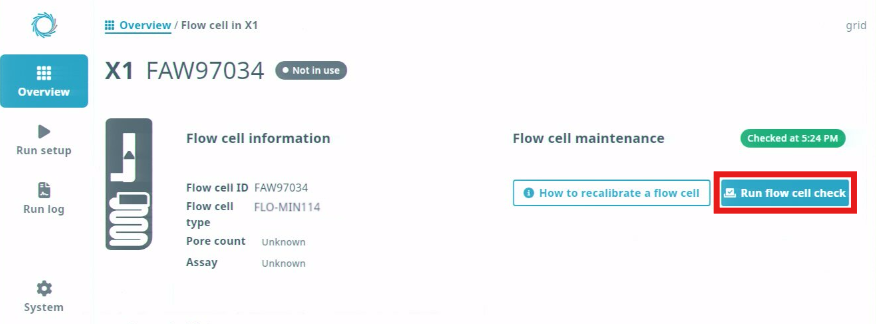
From the Position overview page, click View flow cell on the position you would like to check.
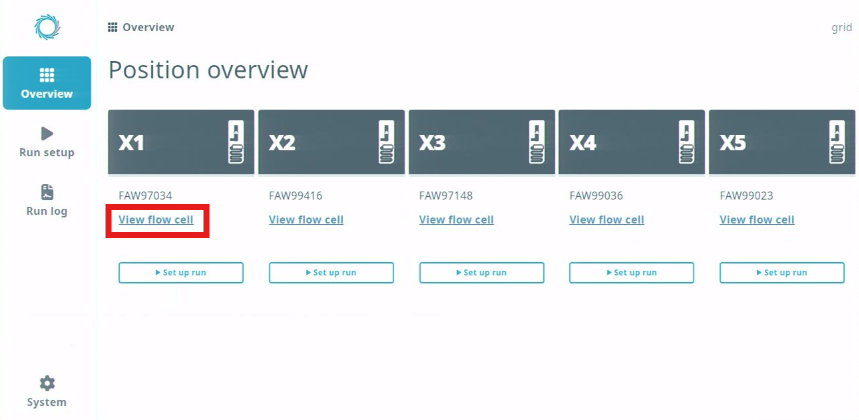
In the Flow cell maintenance panel, click Run flow cell check.
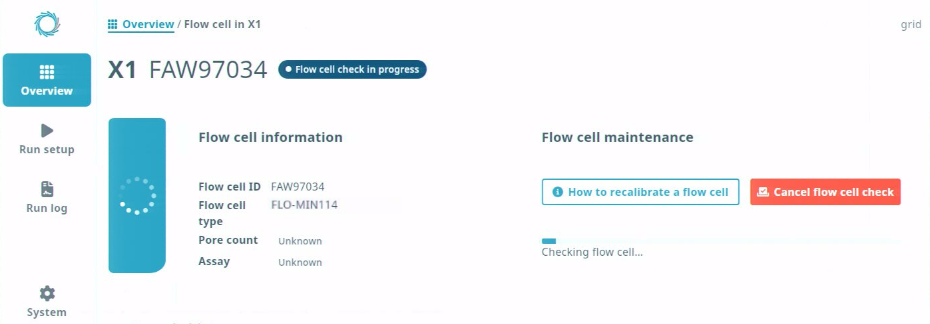
The progress of the flow cell check will be shown in a status bar in the Flow cell maintenance panel.
Once the flow cell check has finished, the results will be displayed on the screen.
Information displayed includes the pass/fail result, flow cell health, pore count, and the time the check was completed. 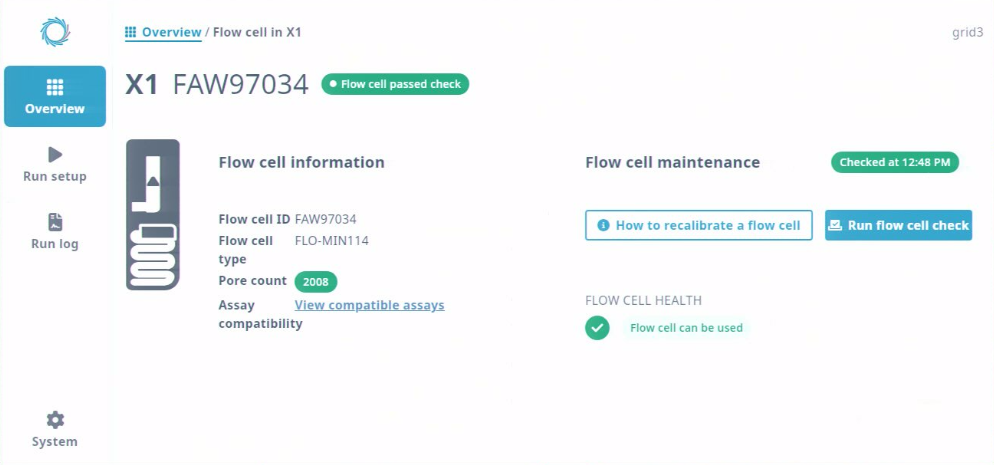
14. Recalibrating a flow cell
Recalibrating a flow cell using the Q-Line Flow Cell Wash Kit aims to remove the initial library and prepare the flow cell for loading a subsequent library. After the flow cell has been recalibrated, a new library can be loaded or the flow cell can be stored at 4°C.
The Flow Cell Wash Kit is compatible with Q-Line MinION DNA Flow Cells (Q-FLO-MIN104, Q-FLO-MIN114).
RNA flow cells do not support recalibration.
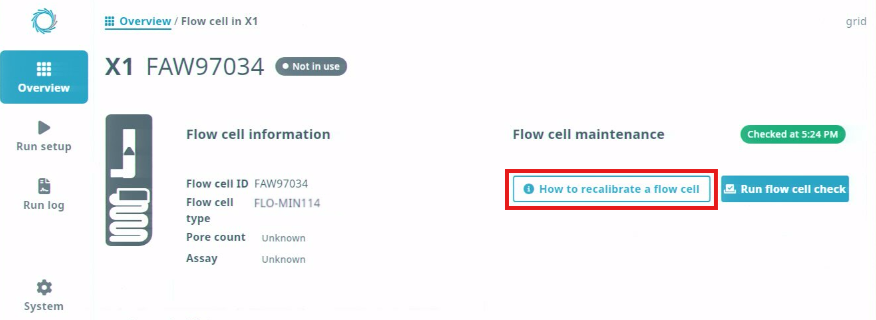
Instructions for recalibrating a flow cell can be found in the software. From the Position overview page, click View flow cell on a position and click How to recalibrate a flow cell in the Flow cell maintenance panel.
15. Flow cell flushing and returns
Request a flow cell returns box.
Request returns boxes at: https://nanoporetech.com/upsflowcellreturn. Please note that the flow cell returns policy might vary by location. Contact your support representative for guidance.
Liquid overflow from the flow cell may be hazardous.
Any liquid overflow may be hazardous and should be disposed of appropriately in accordance with local regulations and not disposed of directly into the domestic water supply. Avoid contact with strong acids or alkalis.
Remove the flow cell and place it on top of sufficient absorbent material on the bench to take up approximately 4 ml of flush waste per flow cell.
Close the SpotON port cover, ensuring the bung enters the SpotON port.
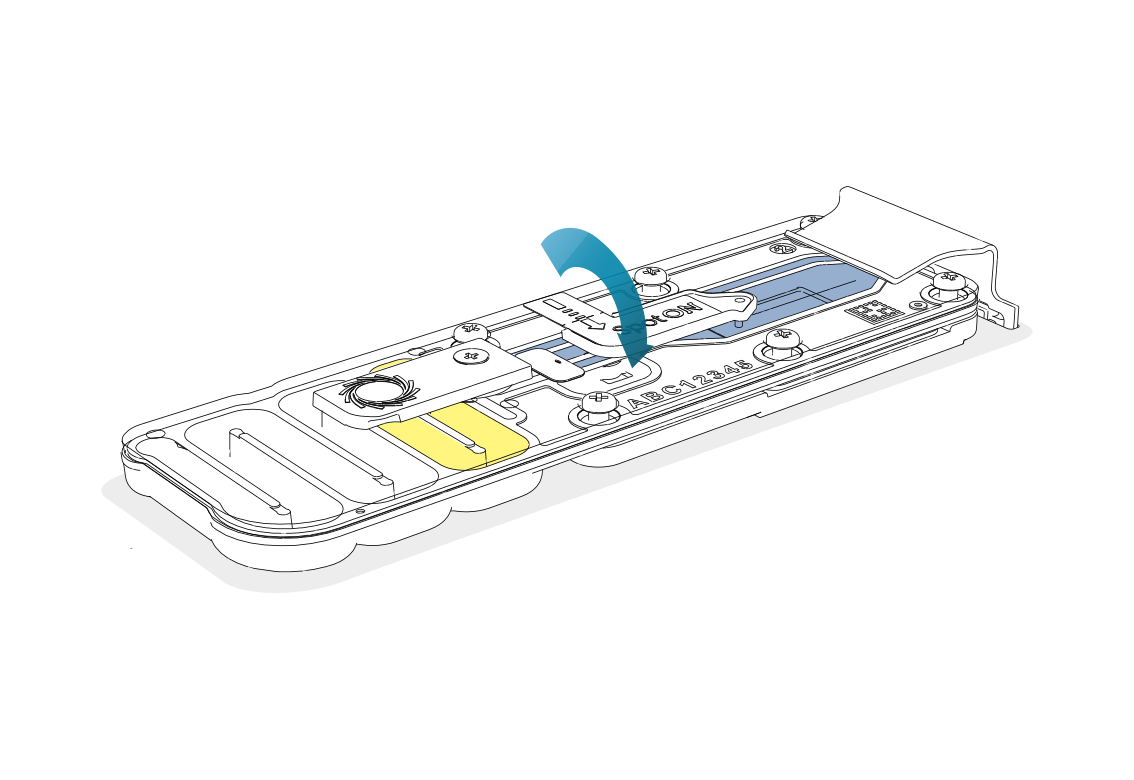
Slide the flow cell priming port cover clockwise to open the priming port.
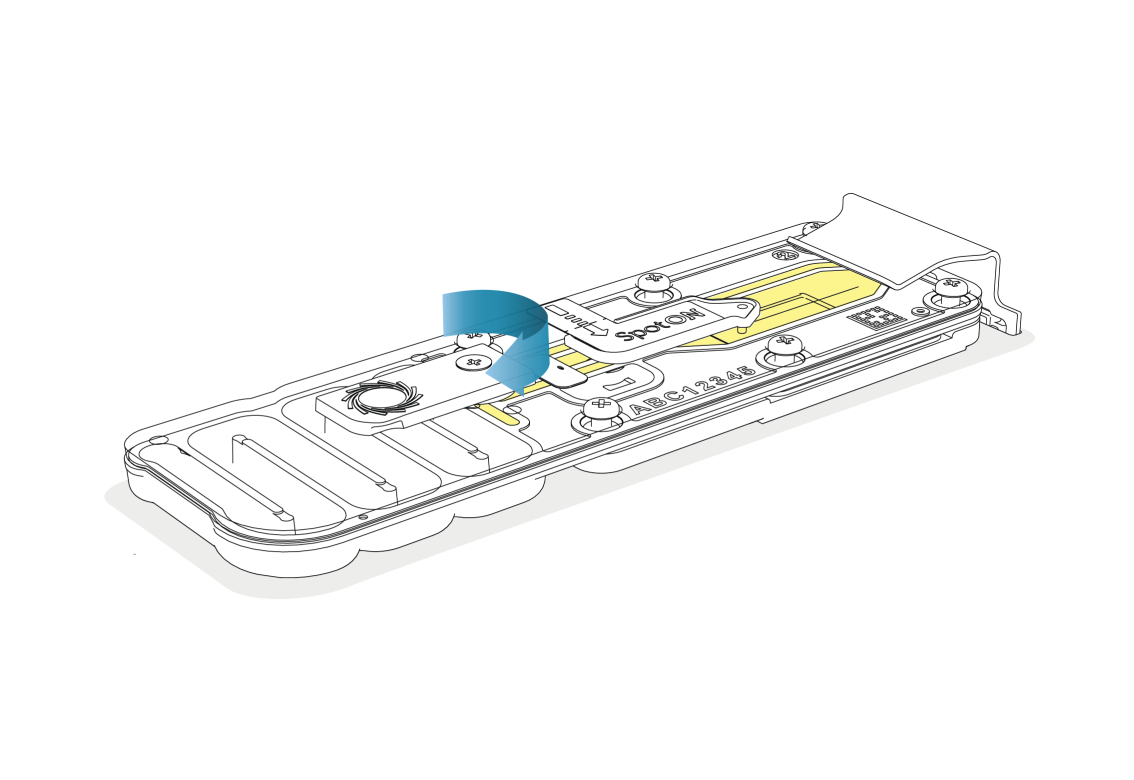
Place the flow cell on the absorbent material at a 45° angle.
The reservoir end of the flow cell should be in contact with the absorbent material, which will capture any overflow of buffer/sample leaving the flow cell.
Using a P1000 pipette, slowly load a total of 4 ml water in 1 ml aliquots via the priming port so that the liquid fills the reservoir all the way to the waste channel port.
Once flushing is complete, close the priming port cover.
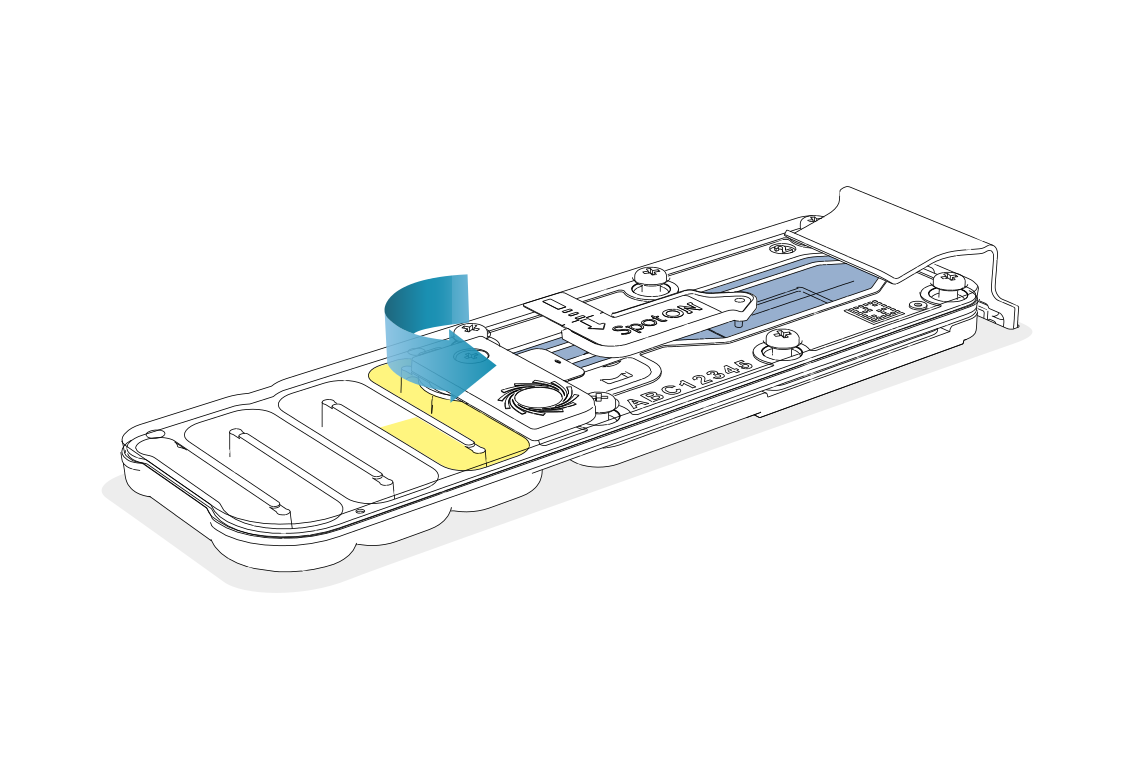
Using the pipette, remove the liquid from the waste reservoir via the waste port 2.
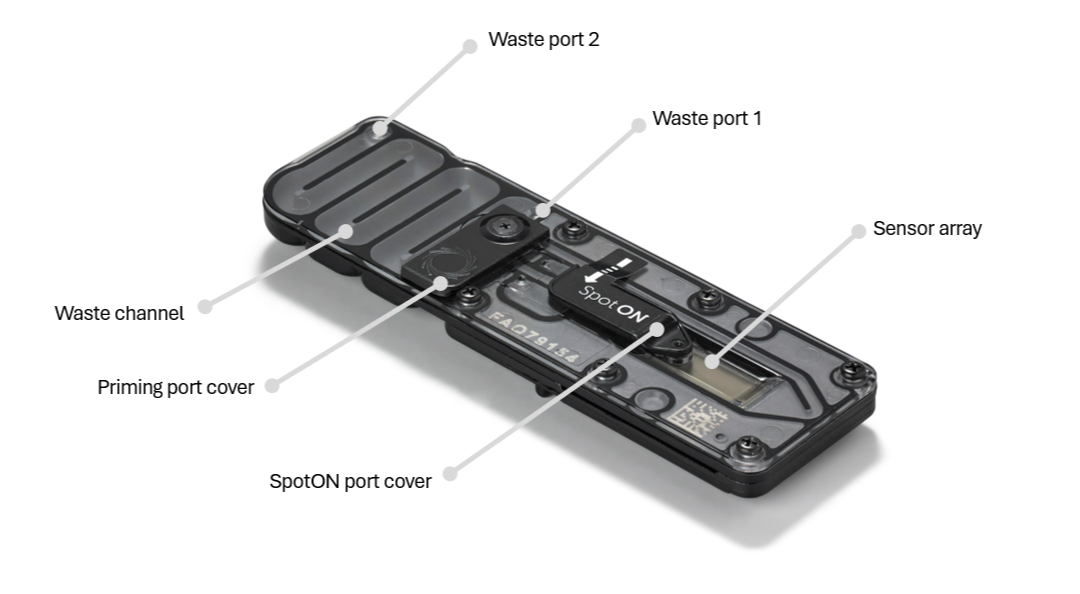
Note: Take care to leave sufficient liquid in the sensor chip area and neighbouring channels to ensure the sensor array remains submerged during transit.
Dispose of the absorbent material as biological waste, as detailed in local guidelines.
Wipe the bench surface with a suitable disinfectant. Do not use any strong acids or alkalis.
Follow the rest of the returns process and book your flow cell collection as described at: https://nanoporetech.com/upsflowcellreturn
16. Accessing and transferring data
After a run has completed, sequencing data can be accessed through the Run log.
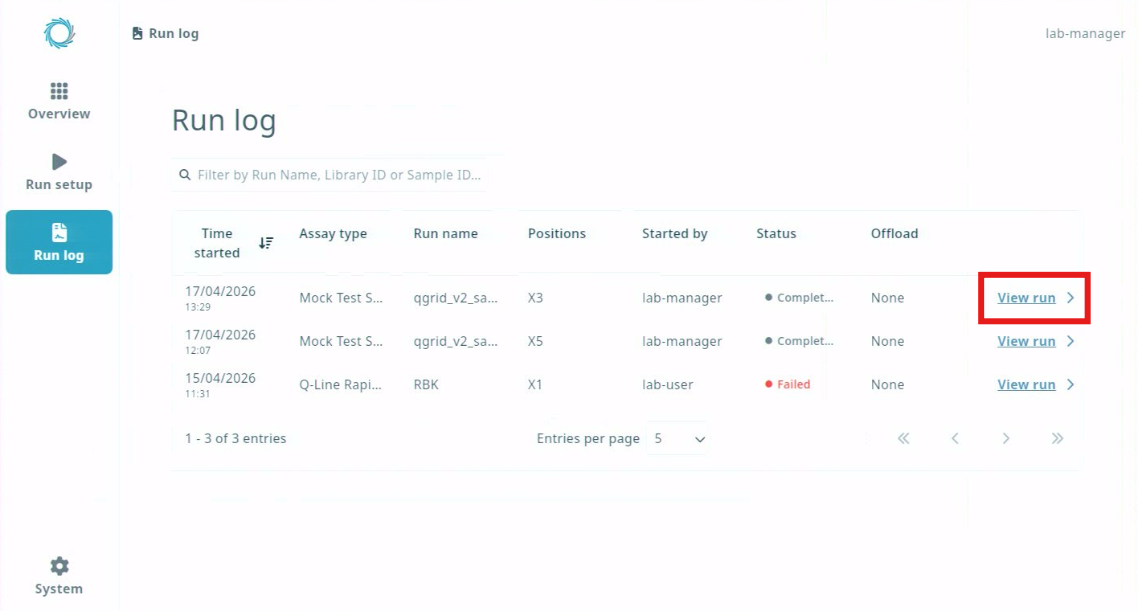
From the Run log, click View run in the row for the run you would like to access.
In the Run summary panel, click View sequencing data to open the directory containing the sequencing data for the run.
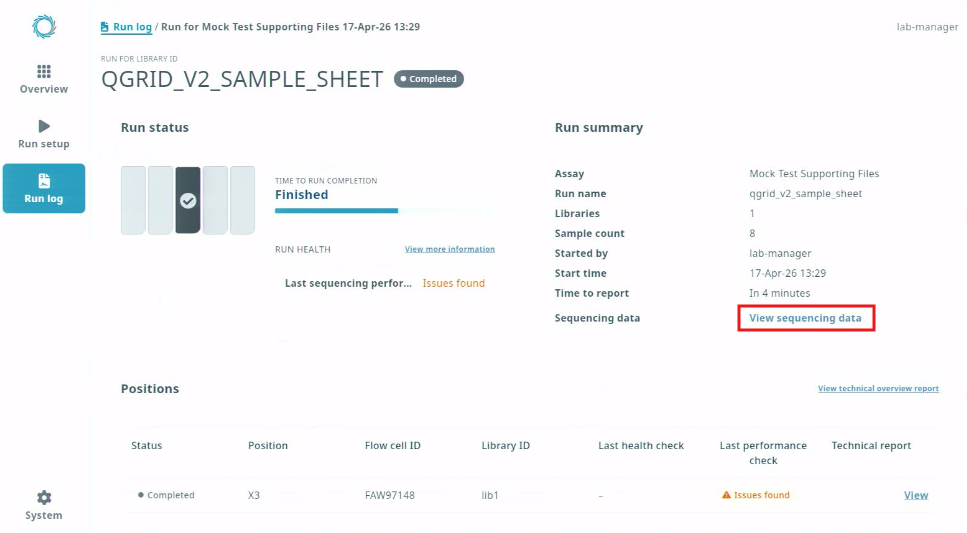
Note: If data offload is enabled, this will be indicated in the Run summary panel and View sequencing data will not be available.
Completed sequencing data is saved in the following directory structure:
/data/output/sequences/<sample_sheet_id>-<unique_id>
where <sample_sheet_id> is provided in the sample sheet, and <unique_id> is a unique value auto-generated by the Sequencing Software for each run.
To manually transfer your data, first locate the file or folder you want to move in the system file browser as described above. Select the file or folder and drag and drop the icon to the desired location.
We recommend automating data transfer as described in the Q-Line GridION configuration guide.
17. Mounting a USB storage device
Removable USB storage devices can be used to transfer data to and from the Q-Line GridION. Do not insert unknown USB devices into the device.
By default, the system will detect inserted USB storage devices and will require your account password to mount them. The steps below describe how to insert and mount a USB device with the default settings.
To modify the USB device mounting settings, refer to the Q-Line GridION configuration guide.
Insert the USB device into one of the USB ports on the rear of the Q-Line GridION.
Using the system file browser, navigate to and click on the USB device.
In the sidebar of the file browser, select the USB device.
In the authentication prompt window, enter your password to mount the USB device.
Note: USB storage devices should be formatted to be usable with a Linux-based file system.
When removing a USB storage device, it is important to first unmount the device. You can do this by clicking the eject icon next to the device in the sidebar of the file browser.
18. Technical run report
Technical run report overview
Run reports contain information about the sequencing run and include performance graphs. These graphs are automatically generated at the end of a run or when you click View in the Run report panel of the Run log tab. 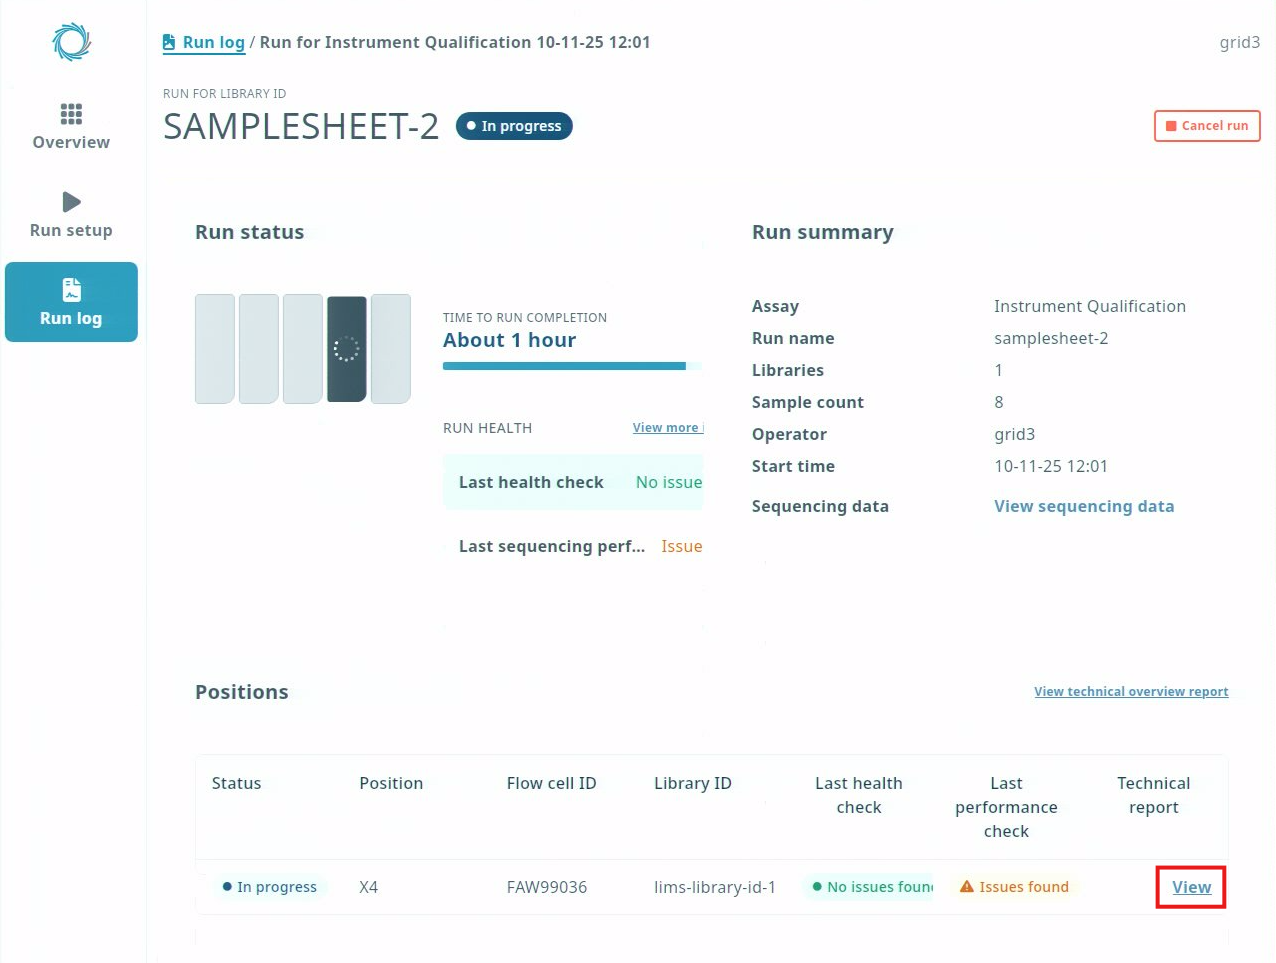
The run report includes panels for the Run summary, Run configuration, Sequence output, Alignment (only if live alignment is part of your assay), Run health and Run log. It is interactive: sections of interest can be expanded and navigated while troubleshooting suggestions are made available for performance enhancement.
Run summary
This is an overview of the sequencing run, including output and basecalling results and the duration of the run.
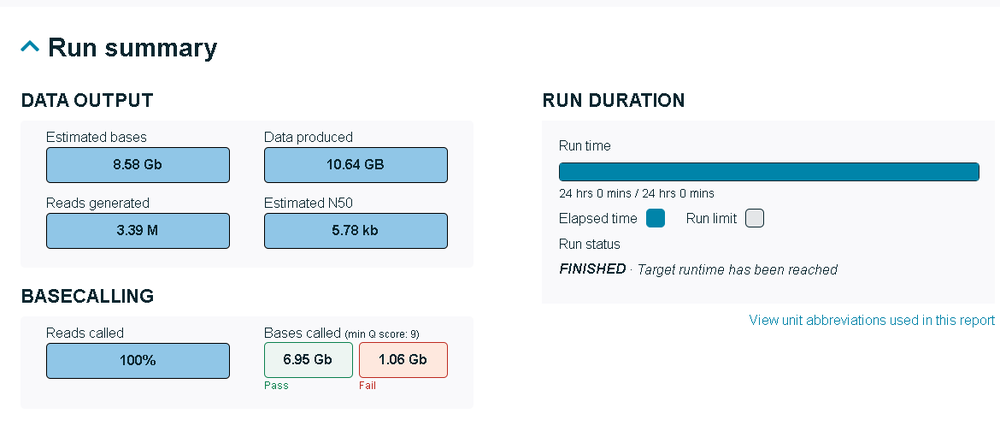
Run until
This section will show the progress information against any run until parameters defined in the assay configuration file.

Run configuration
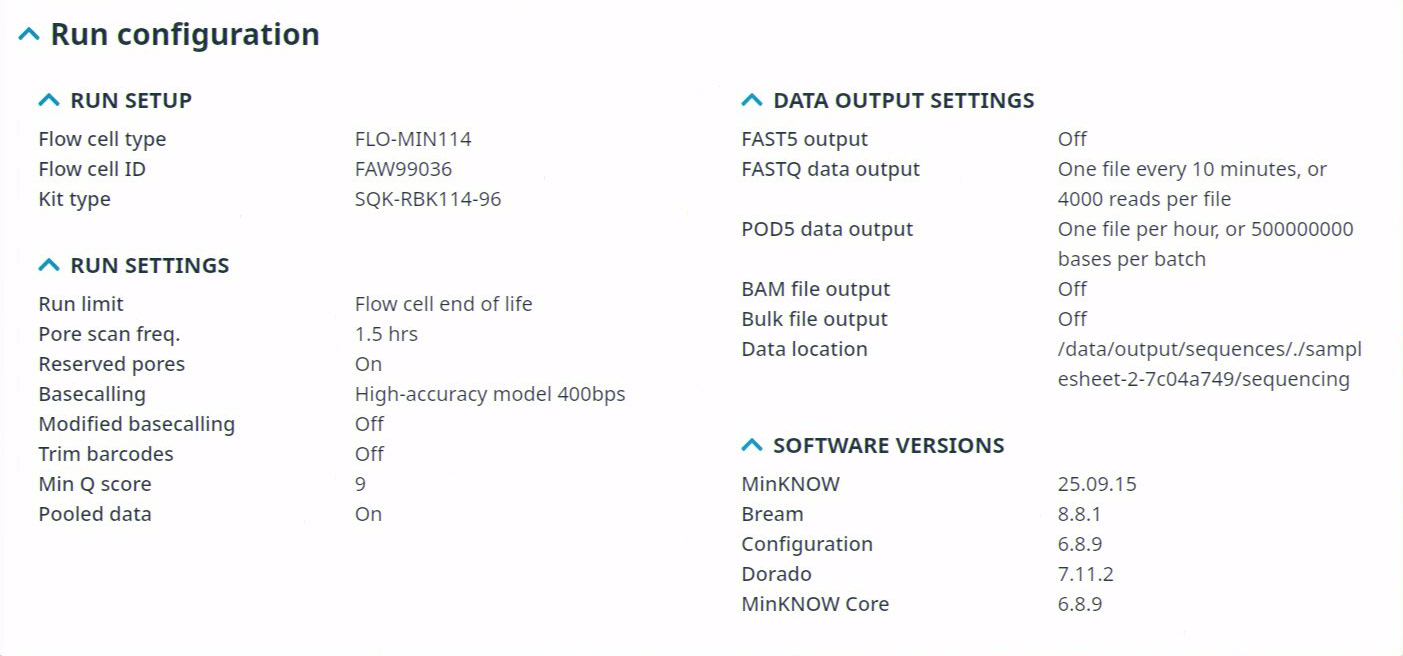
A detailed overview of the settings selected for the sequencing run and data output is shown in this section, including the software versions used to sequence the data. It also includes further information about the modified bases and basecalling models used, expansion kits used and read-splitting preferences.
Sequence output
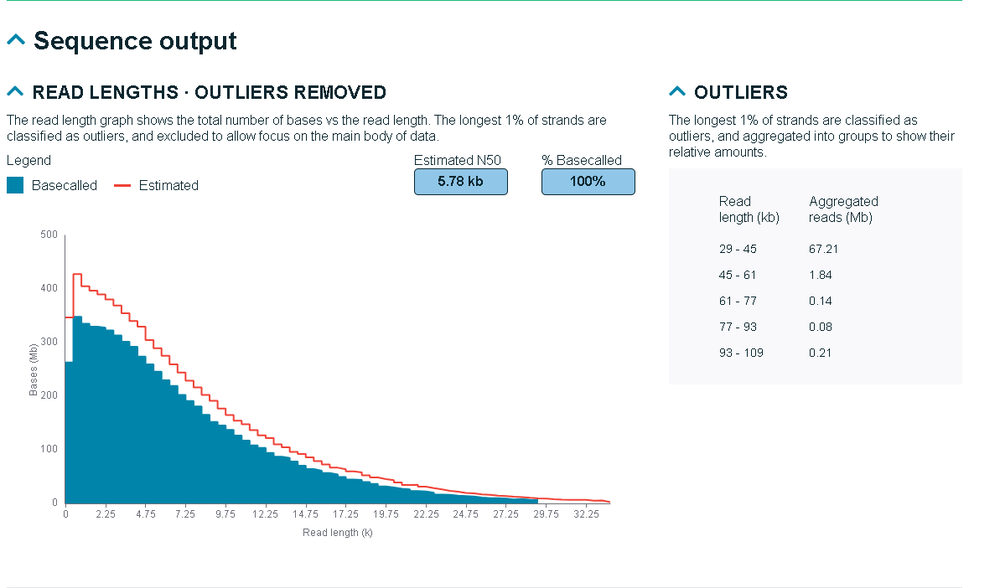
This section includes a more detailed view of the sequencing output, such as read lengths, barcodes detected and quality score. This section of the Technical run report displays Read lengths, Barcodes, Cumulative output and Quality scores data.
Read lengths This graph shows the total number of bases against the read length. Any outliers are displayed in the table below, displaying read length and aggregated reads.
Cumulative output
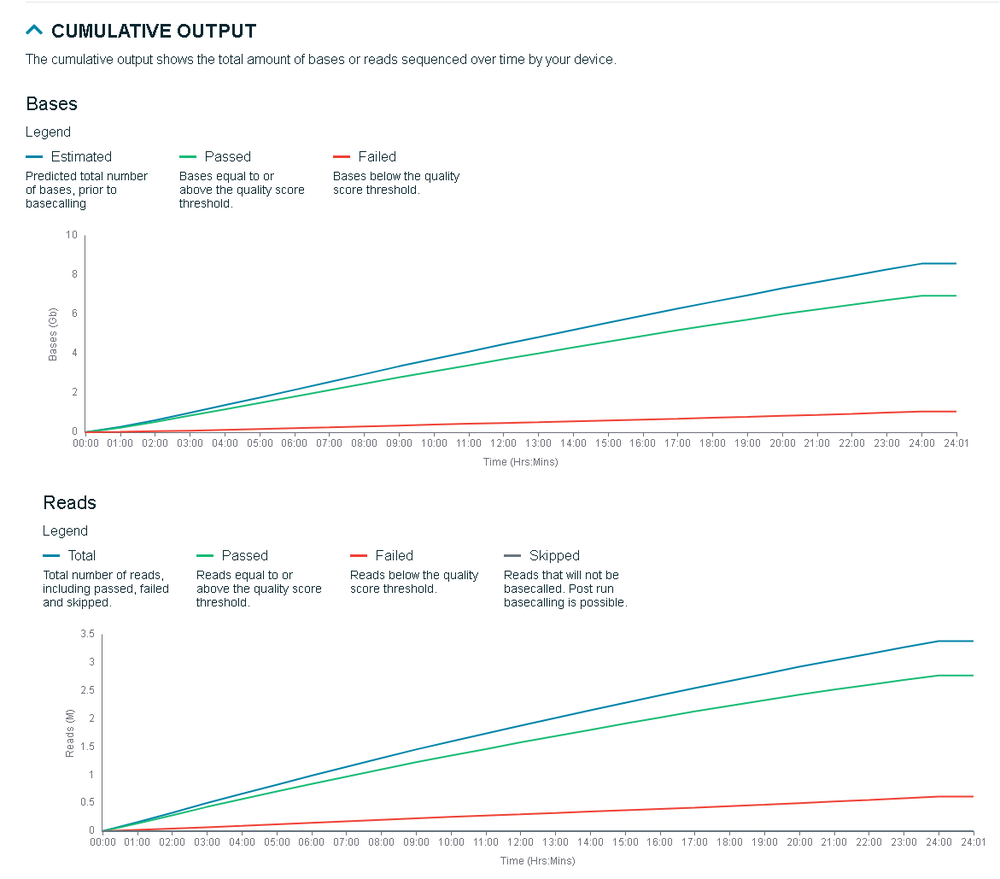
The graphs show the total output of the bases and reads sequenced during the experiment.
Barcodes
Barcodes detected are displayed in a searchable table which can be exported as a .CSV file. Two graphs for bases and reads are available to view and display total number of reads/bases above a Q score of 9. Passed and failed data is also displayed and can be sorted by barcode.
Detected barcodes: 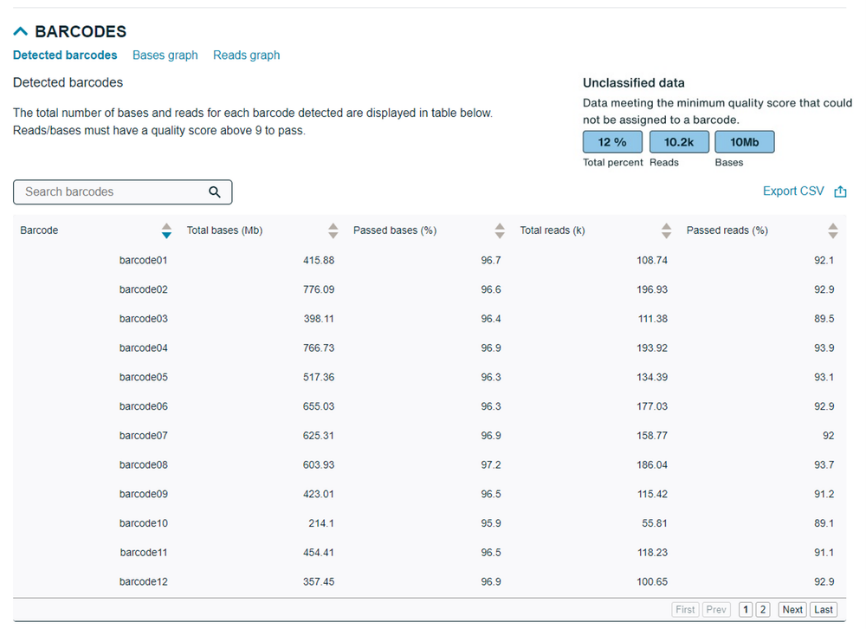
Bases graph: 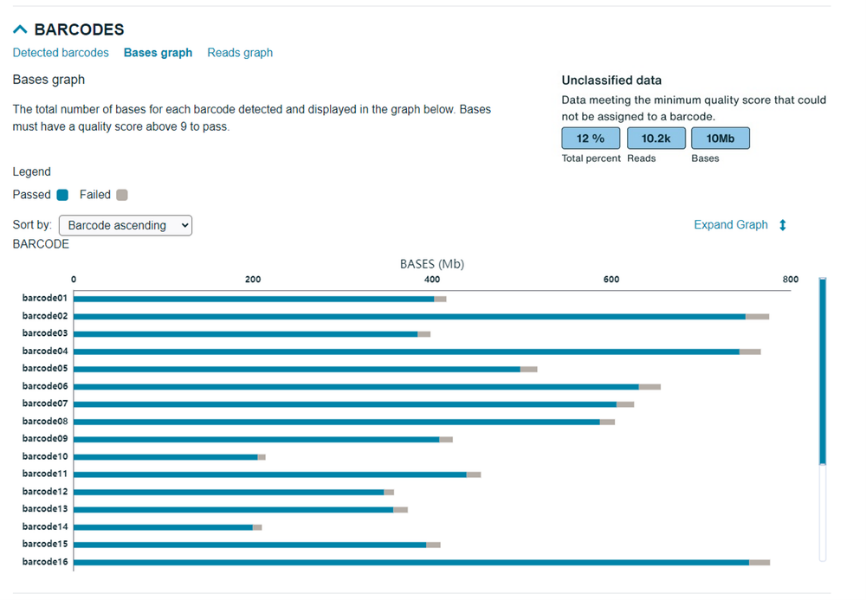
Reads graph: 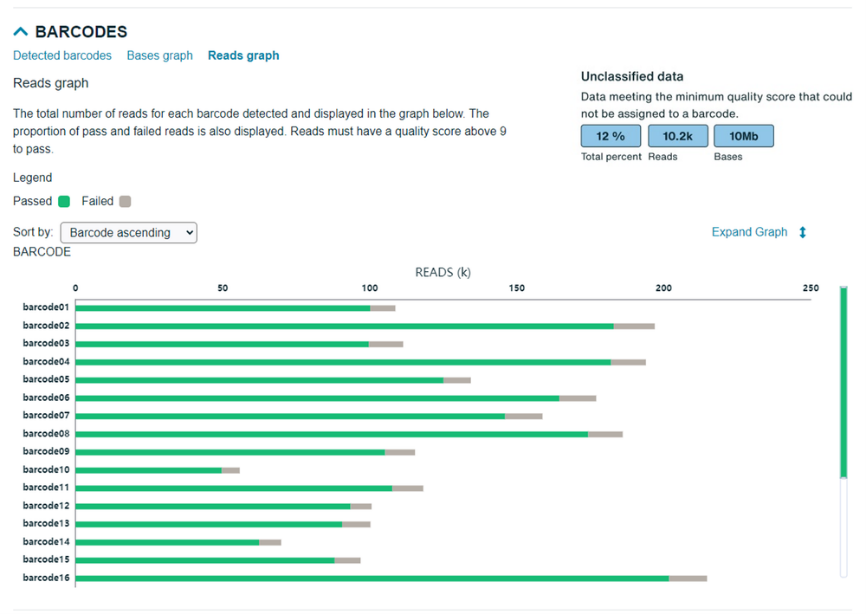
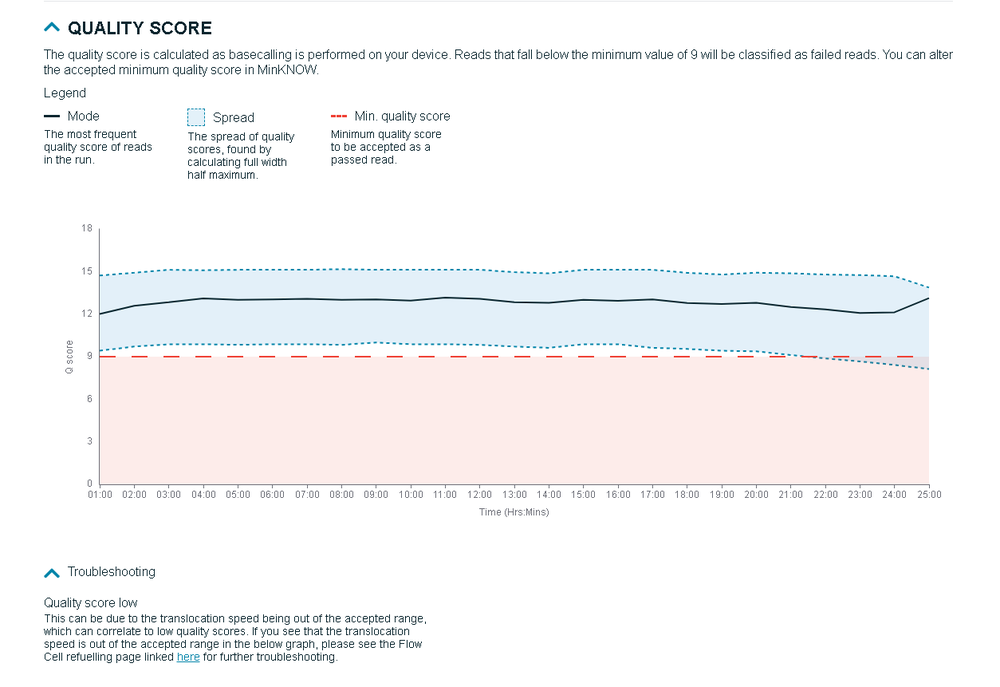
Quality score
The quality score is calculated as basecalling is performed on your device. Reads that fall below the minimum Q score of 9 will be classified as failed reads. You can alter the accepted minimum quality score in the assay configuration file.
Alignment
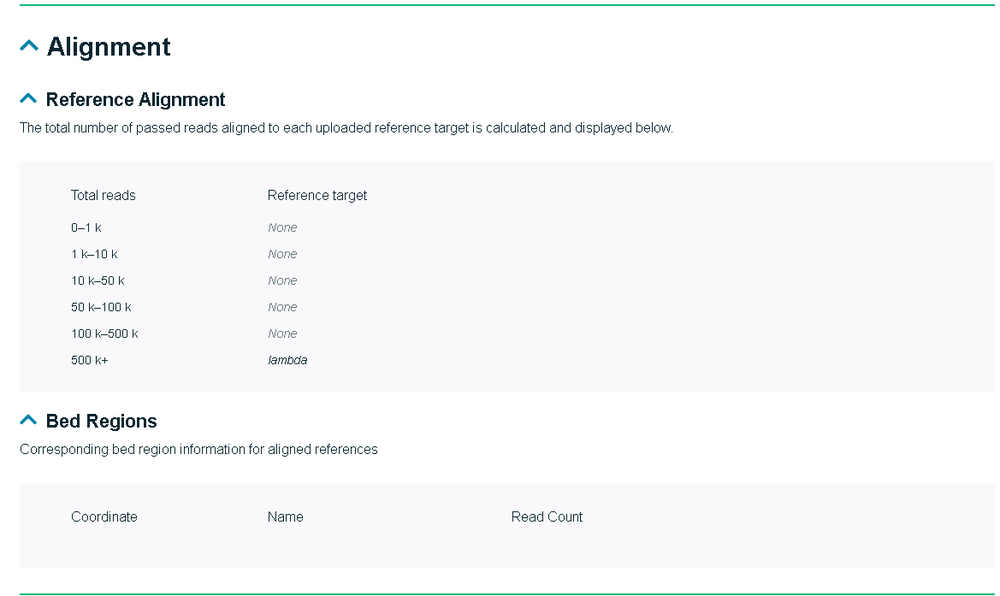
This section will appear in your Technical run report if an alignment file was provided and Alignment enabled in the assay configuration file.
Reference alignment: This section will display the total number of passed reads aligned to each uploaded reference target, calculated and displayed.
Bed regions: If there is corresponding .bed region information for aligned references, it will be shown here.
Run health
This section provides a detailed view of the Pore activity and Pore scan results throughout the run, along with graphs displaying the translocation speed and temperature.
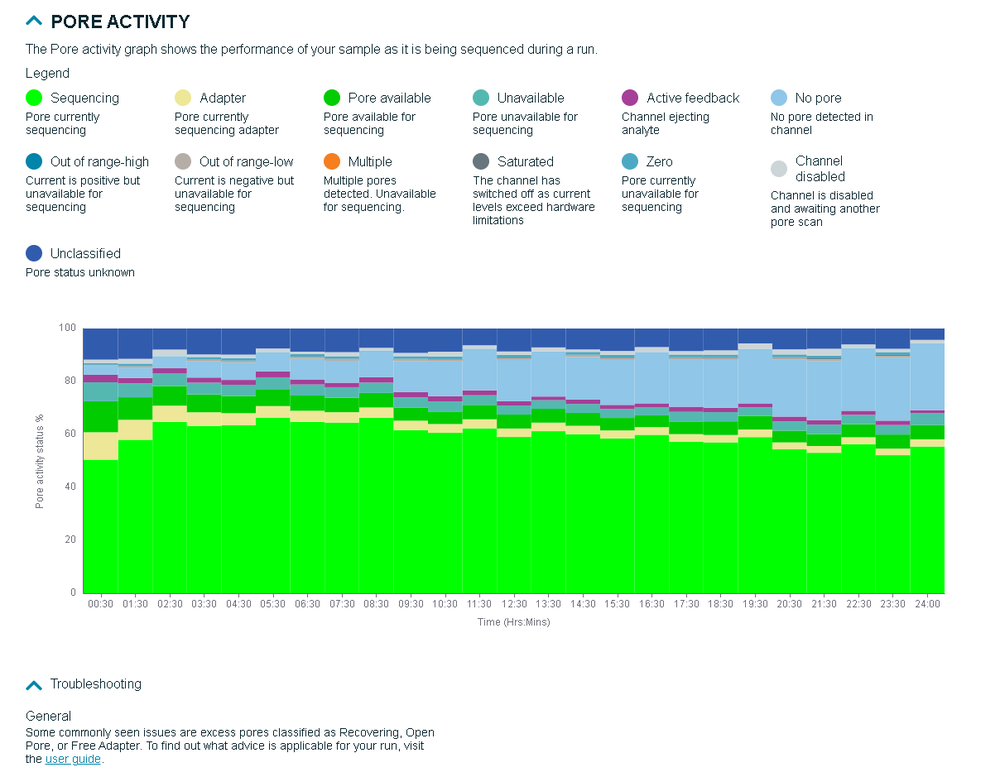
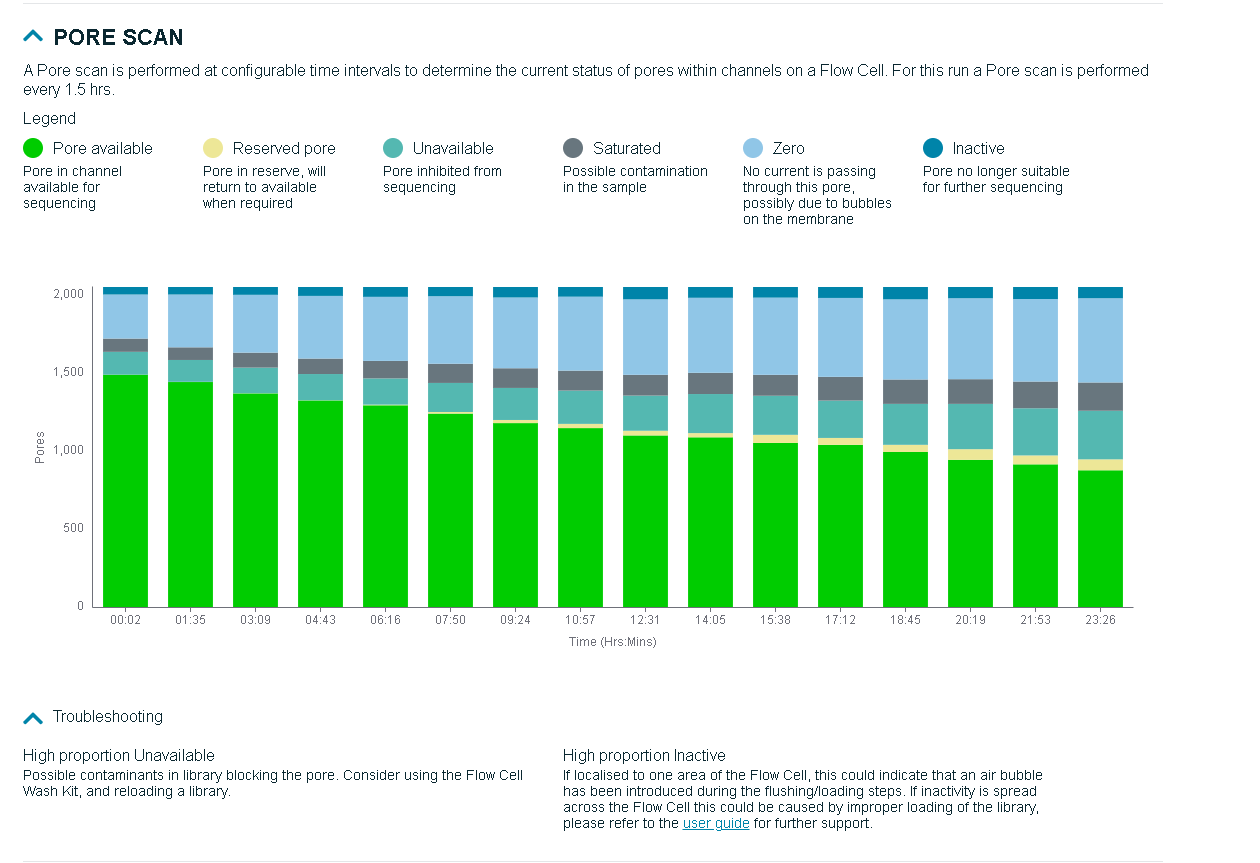
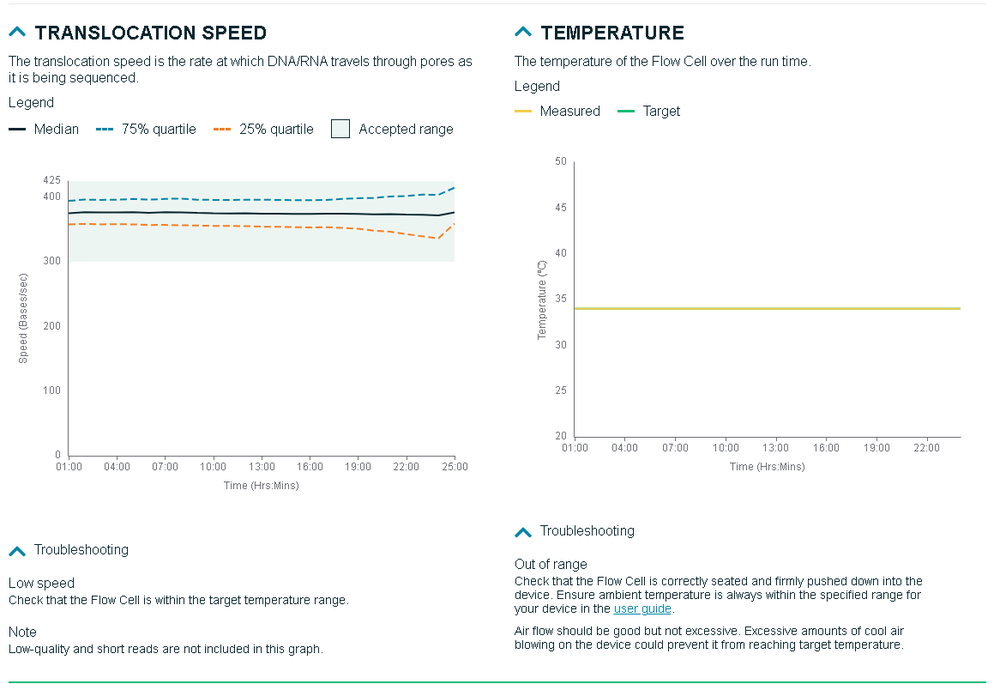
Run log
The run log includes system messages sent during the sequencing run regarding errors, warnings, and any events.
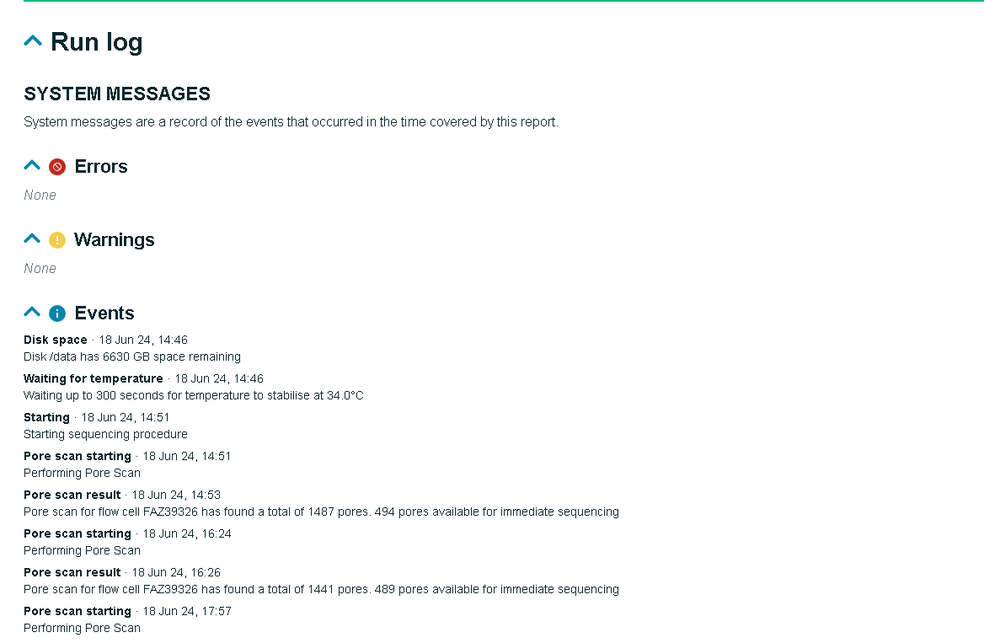
19. Product use restriction/warranty
This product is for Research Use Only. Not for use in diagnostic procedures.
Oxford Nanopore Technologies products are shipped with documentation stating specifications, performances, and other technical information.
20. Troubleshooting
For troubleshooting advice, please contact technical support at: support@nanoporetech.com.
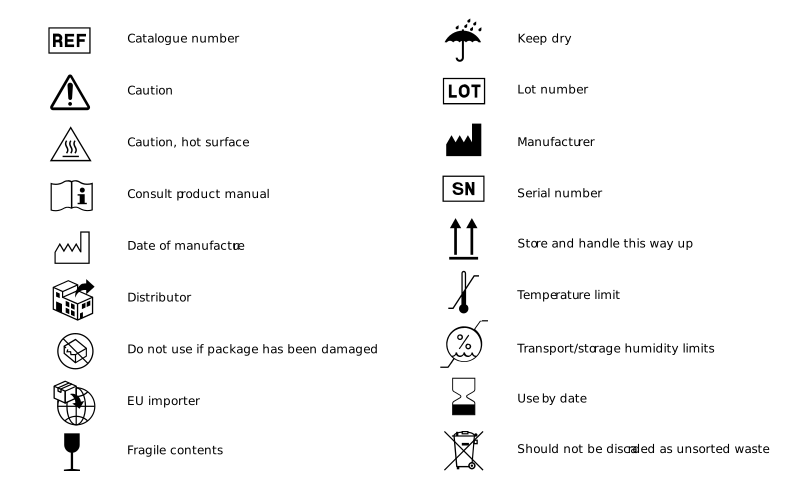
21. Symbols